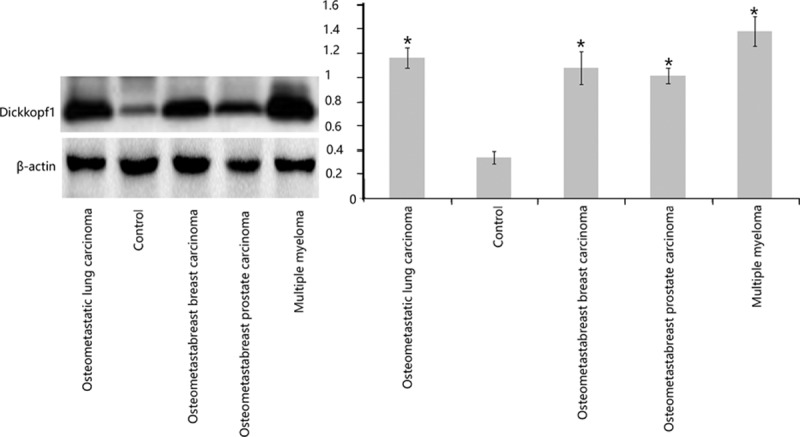
Figure 2.

Western blot showing elevated levels of Dickkopf-1 in the osteometastatic lesions compared with the controls A representative blot is shown here. Triplicate samples were analyzed to obtain the quantitative intensities of the protein signals for Dickkopf-1 and β-actin (the loading control). These means between the groups were different and were statistically significant when examined by analyses of variance (∗P <0.01).
