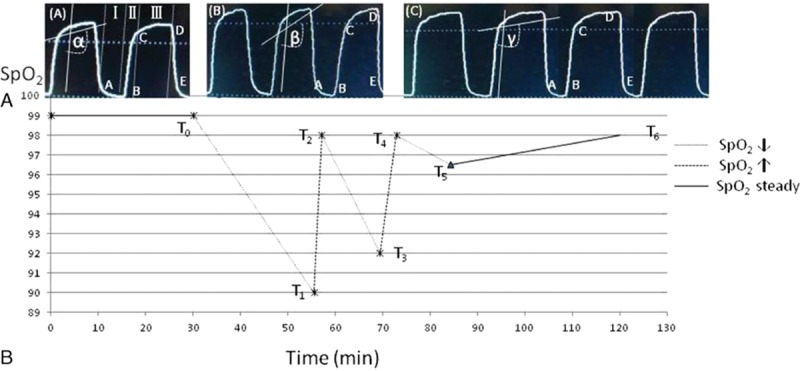
Figure 2.

Upper panel (A): the CO2 waveform was obtained from an adult patient by the real-time monitor. Note the qualitative difference in the Phase II segment of this CO2 waveform when compared with that of differences between the different parameters setting during L-OLV and TLV. (a)-(A) Capnogram, PETCO2 was plotted against time (sec) for 1 single-breath during TLV (as q.v. basic waveform). (a)-(B) Capnogram, after application of OLV, displays actual difference of an expired breath during OLV, the slope of the alveolar plateau (angle β vs angle α) was steeped. (a)-(C) Capnogram, by setting trapezoid shape similar to (a)-(A). Lower panel (B): displays actual time point of relevance between the SpO2 change and the intraoperative during mechanical ventilation with TLV and L-OLV or was performed with CPAP to both lung using the hand bag.
