
Figure 2.
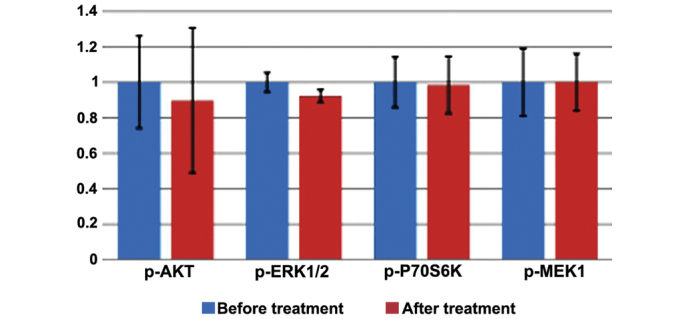
Expression level of phosphoproteins in the clinical specimens of invasive breast cancers, prior to (in blue) and subsequent to (in red) treatment with trastuzumab. Histogram shows the mean ± standard deviation (error bars) of phosphoprotein expression. p-, phosphorylated; AKT, protein kinase B; ERK1/2, extracellular signal regulated kinase 1/2; P70S6K, ribosomal protein S6 kinase B1; MEK, mitogen-activated protein kinase kinase 1.