
FIGURE 2.
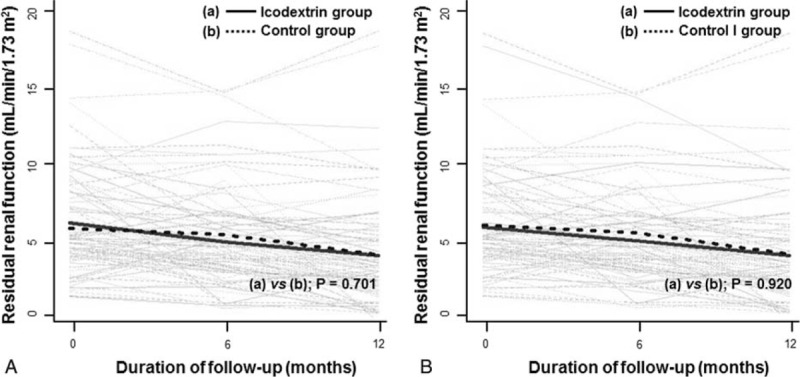
Changes in residual glomerular filtration rates overtime between groups. (A) intention-to-treat analysis, (B) per-protocol analysis. Gray lines represent individual patient measurements, and solid and dash lines represent predicted slopes.
Official websites use .gov
A
.gov website belongs to an official
government organization in the United States.
Secure .gov websites use HTTPS
A lock (
) or https:// means you've safely
connected to the .gov website. Share sensitive
information only on official, secure websites.
Changes in residual glomerular filtration rates overtime between groups. (A) intention-to-treat analysis, (B) per-protocol analysis. Gray lines represent individual patient measurements, and solid and dash lines represent predicted slopes.