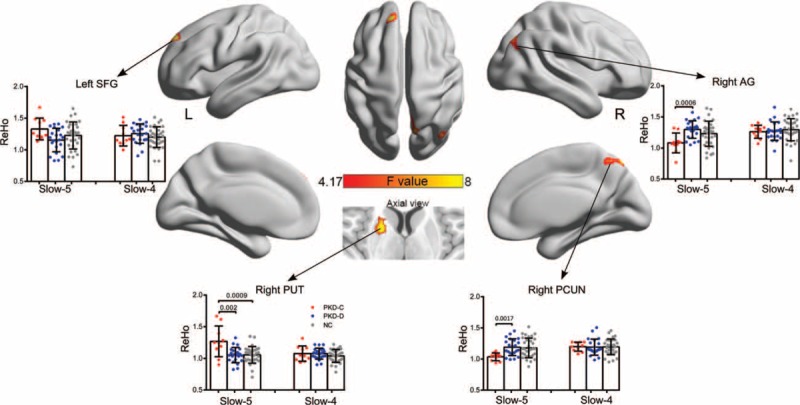
FIGURE 2.

Interaction effects between frequency bands and groups on ReHo examined using 2-way mixed design ANOVA and post-hoc tests. Significant differences in ReHo identified based on the interaction effects were observed in the right precuneus, right putamen, right angular, and left superior gyrus. P < 0.05, Bonferroni correction for number of ROI and times for comparison. ANOVA = analysis of variance; ReHo = regional homogeneity.
