
FIGURE 1.
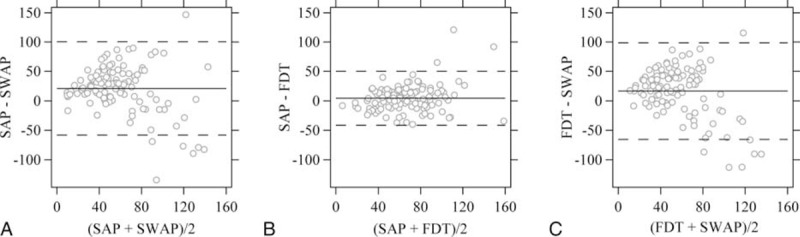
Limits of agreement between different test types on the estimate of global mean sensitivity in percent of mean normal. (A) Between SAP and SWAP; (B) between SAP and FDT; and (C) between SWAP and FDT. The horizontal axis shows the average global mean sensitivity with each pair of tests for each eye. The vertical axis shows the difference of global mean sensitivity within each pair of tests. The solid lines and the dashed lines represent the mean difference and corresponding 95% limits of agreement. FDT = frequency-doubling technology perimetry, SAP = standard automated perimetry, SWAP = short-wavelength automated perimetry.