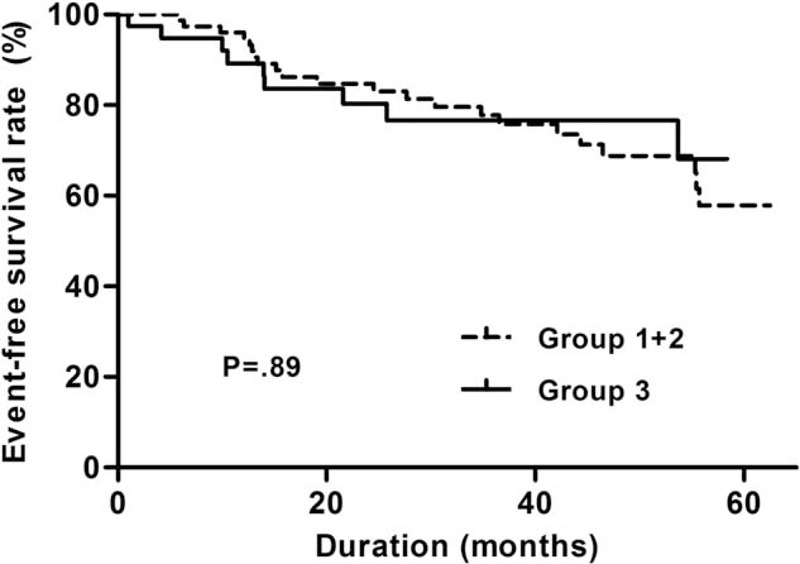
FIGURE 2.

Kaplan–Meier plots for all-cause mortality-free survival between the lower two and the highest mtDNA copy number tertile groups. Lowest, middle, and highest mtDNA copy number groups are expressed as group 1, 2, and 3, respectively. mtDNA = mitochondrial DNA.
