
FIGURE 2.
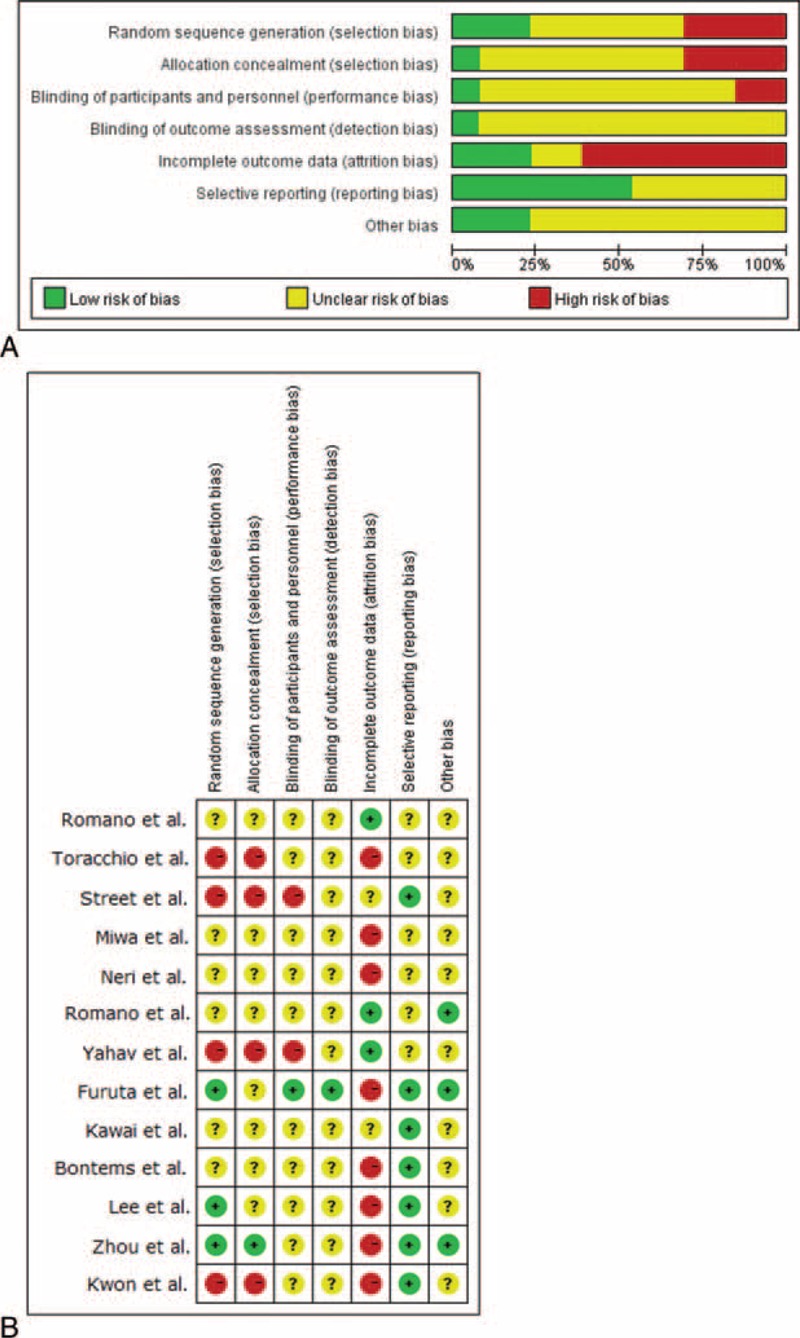
A, Risk of bias graph: reviewer's judgments about each risk of bias item presented as percentages across all included studies. B, Risk of bias summary: reviewer's judgments about each risk of bias item in each study. (+) = low risk of bias, (?) = unclear, (−) = high risk of bias.