
FIGURE 4.
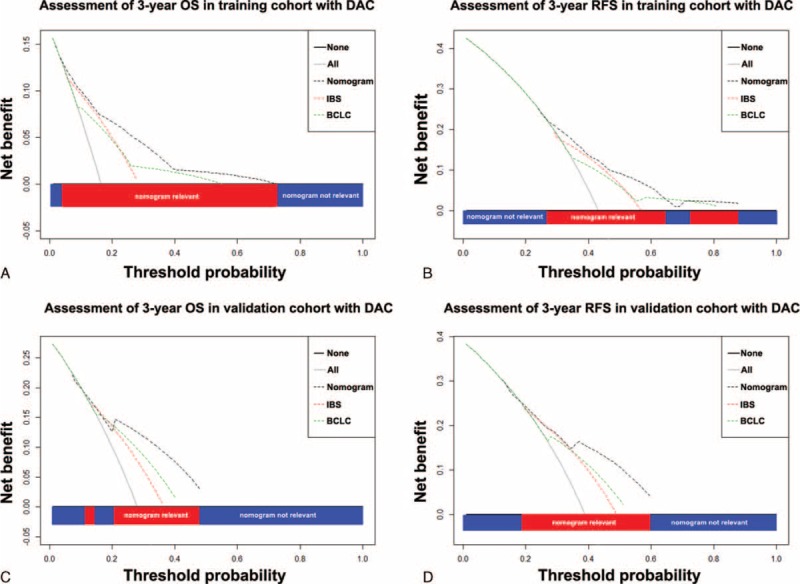
Decision curve analysis. Decision curve analyses depict the clinical net benefit in pairwise comparisons between integrated nomogram and BCLC stage. Nomogram is compared against the BCLC stage in terms of 3-year OS (A and C) and 3-year RFS (B and D) in training and validation cohort, respectively. Dashed lines indicate the net benefit of nomogram in each of the curves across a range of threshold probabilities. The horizontal solid black line represents the assumptions that no patients will experience the event, and the solid gray line represents the assumption that all patients will relapse. On decision curve analysis, nomogram showed superior net benefit compared with BCLC stage across a range of threshold probabilities. BCLC = Barcelona Clinic Liver Cancer, OS = overall survival, RFS = recurrence-free survival.