
FIGURE 2.
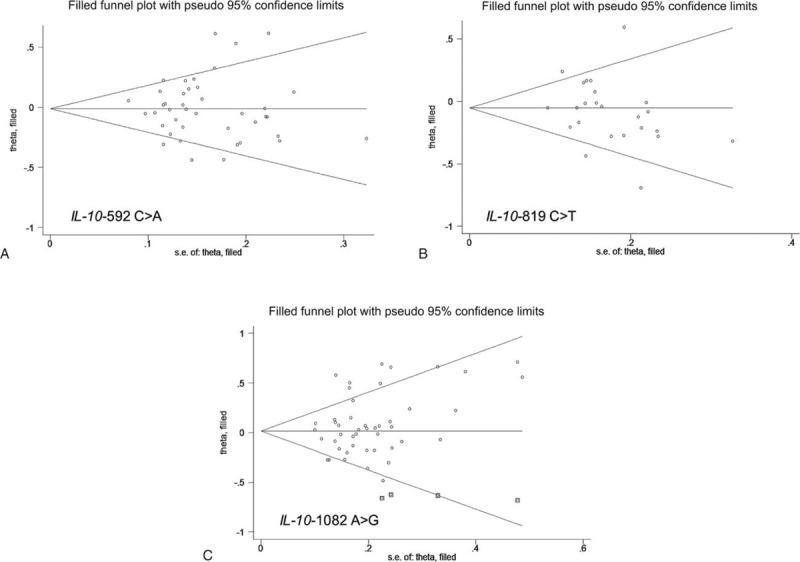
Funnel plots for studies investigating the effect of IL-10 gene 3 variants on digestive cancer risk. Vertical axis represents the log of OR; horizontal axis represents the SE of log (OR). Funnel plots are drawn with 95% confidence limits. The graphic symbols represents the data in the plot be sized proportional to the inverse variance. IL-10 = interleukin-10, OR = odds ratio, SE = standard error.