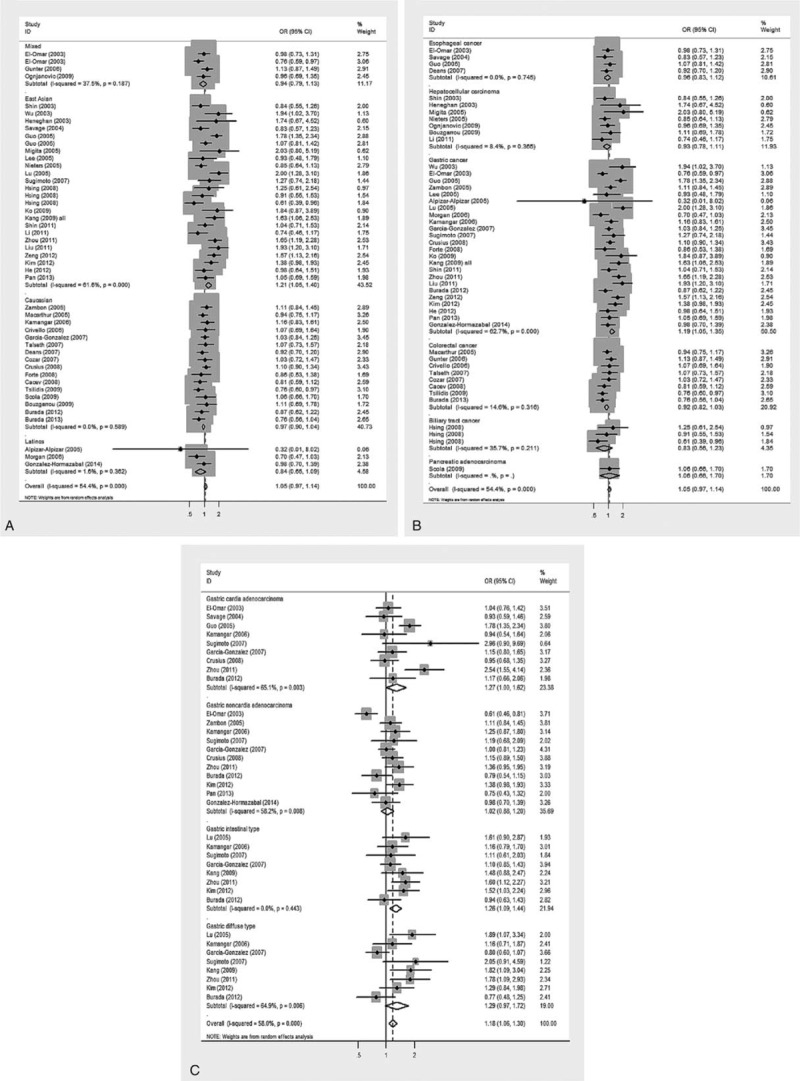
FIGURE 3.

Risk estimates of IL-10 gene -1082A>G for cancer risk under the allelic model. (A) East Asian population, (B) gastric cancer groups, and (C) intestinal type of gastric cancer. The summary treatment effect (OR) is shown by the middle of a solid diamond whose left and right extremes represent the corresponding 95% CI. Horizontal axis represents OR values, which were calculated against healthy controls. 95% CI = 95% confidence interval, IL-10 = interleukin-10, OR = odds ratio.
