FIGURE 4.

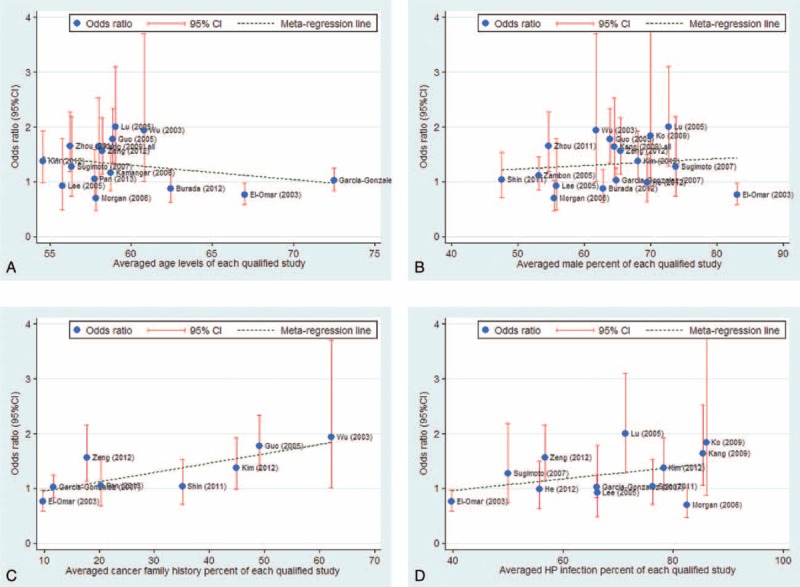
Meta-regression fitted lines by age (A), sex (B), family history of cancer percent (C), and Helicobacter pylori infection percent (D).

Meta-regression fitted lines by age (A), sex (B), family history of cancer percent (C), and Helicobacter pylori infection percent (D).