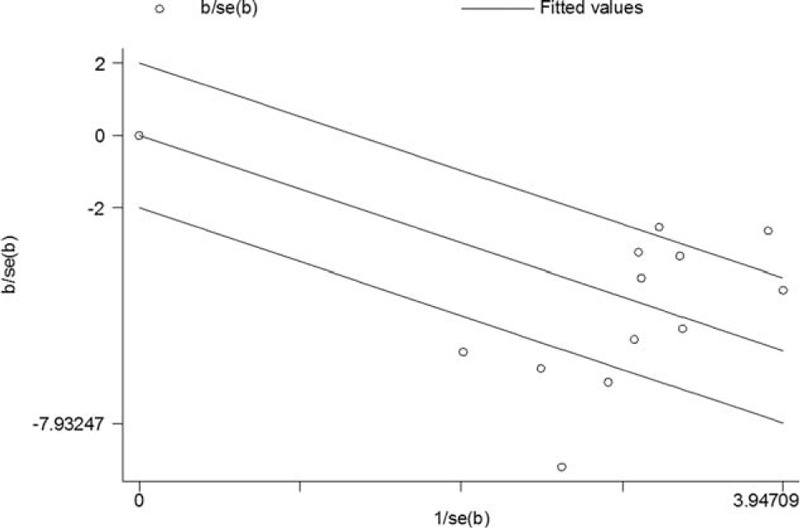
FIGURE 2.

The Galbraith figure including the studies that focused on the correlation between CD34 expression levels and WHO grades. Circles distributed within the region bounded by the upper and lower lines were taken as evidence of homogeneity. If the circles were farther away from that region, it indicated heterogeneity.
