FIGURE 4.

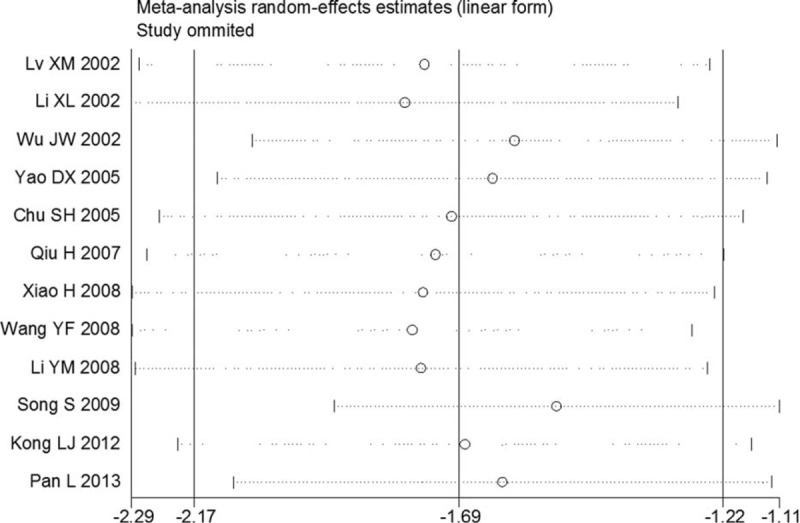
Sensitivity analysis for the 12 included studies. Each article was omitted in turn and the result was computed. A meta-analysis random-effects estimate (exponential form) was obtained. The ends of the dotted lines represent the 95%CI.

Sensitivity analysis for the 12 included studies. Each article was omitted in turn and the result was computed. A meta-analysis random-effects estimate (exponential form) was obtained. The ends of the dotted lines represent the 95%CI.