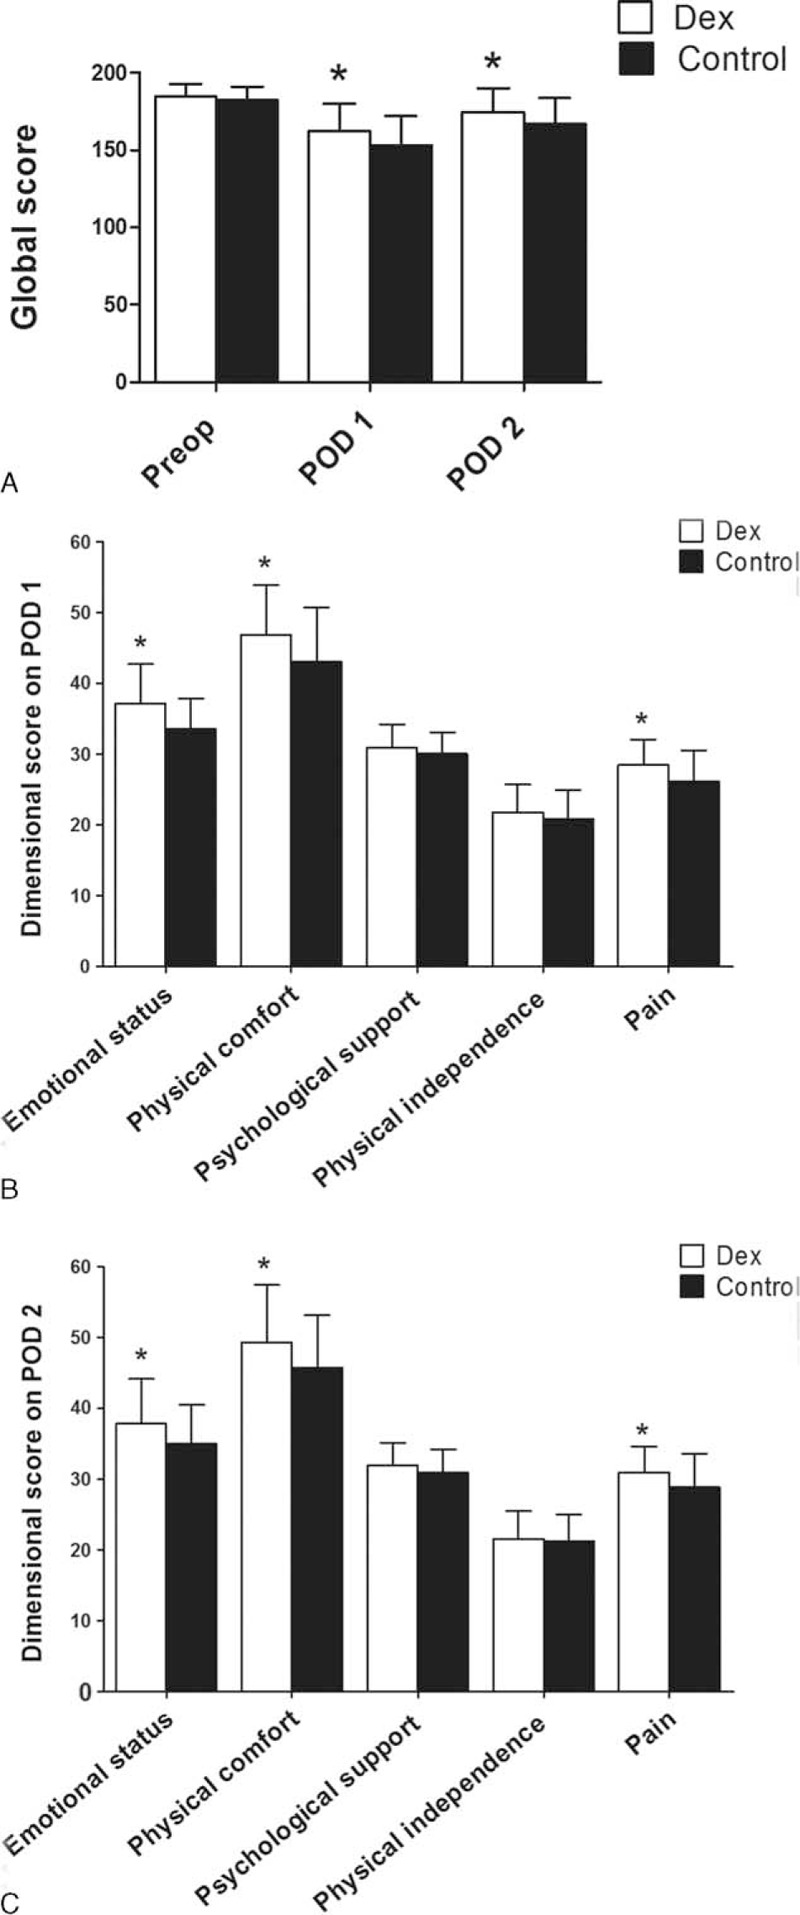
FIGURE 2.

Changes in QoR-40 global and dimensional scores between Dex and Control groups. Variables presented as mean ± standard deviation. POD = postoperative day, Preop = preoperative, QoR-40 = quality of recovery 40 questionnaire. ∗P < 0.05 compared with Control group.
