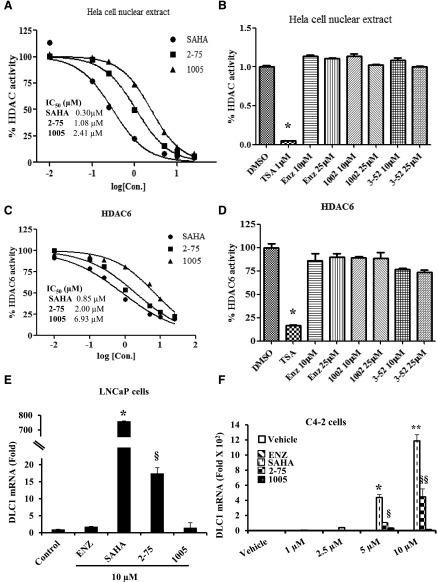
Fig. 2.
Measurement of intrinsic and in situ HDACI activities. (A) Dose-dependent inhibition of HDACs from HeLa cell nuclear extract by 2-75, 1005, and SAHA. HeLa cell nuclear extract was incubated with each drug at the indicated concentrations. IC50 values were calculated from nonlinear regression plots using GraphPad Prism5 software. (B) Enz, 1002, and 3-52 were tested against HeLa cell nuclear extract at 10 µM and 25 µM and TSA (1 µM) was used as a positive control. (C) Dose-dependent inhibition of recombinant HDAC6 by 2-75, 1005, and SAHA. Recombinant HDAC6 was incubated with each drug at the indicated concentrations. IC50 values were calculated from nonlinear regression plots using GraphPad Prism5 software. (D) Enz, 1002, and 3-52 were tested against recombinant HDAC6 at 10 µM and 25 µM and TSA (1 µM) was used as a positive control. (E) LNCaP cells were treated with the indicated compounds (10 µM) or vehicle (DMSO) for 48 hours. Cells were then harvested to quantify mRNA for DLC1 and values were normalized to the values for GAPDH mRNA. (F) C4-2 cells were treated with the indicated concentrations of Enz, SAHA, 2-75, or 1005 or vehicle (DMSO) for 48 hours. Cells were then harvested to quantify mRNA for DLC1 and values were normalized to the values for GAPDH mRNA. In all panels, the error bars represent the standard deviation of experimental triplicates. Where indicated *, **, §, §§, P < 0.05. DMSO, dimethylsulfoxide; TSA, trichostatin A.

