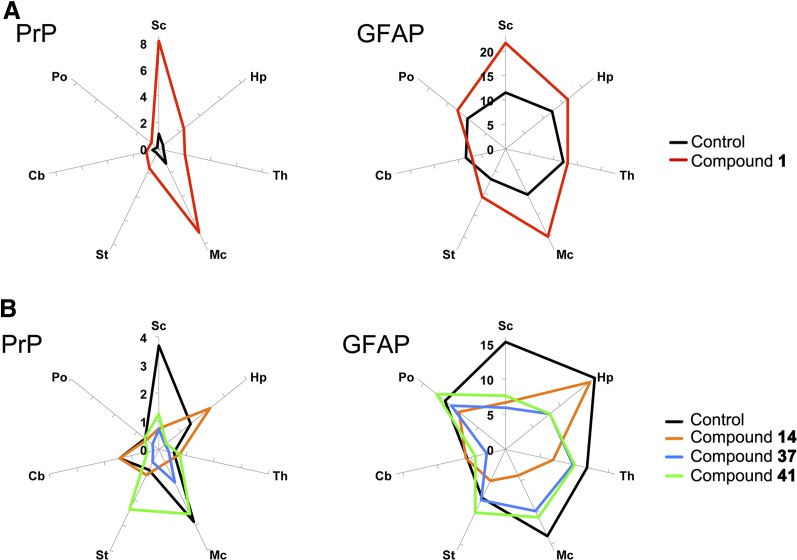
Fig. 5.
Quantitation of neuropathological lesions in RML-infected mice treated with aryl amides. Radar plots of lesion profiles representing the average percentage area stained for PrP (left panels) and GFAP (right panels) in multiple brain regions of WT (A) and Tg4053 (B) mice (n = 4–8 for each treatment). (A) Treatment with compound 1 (red) showed greatly increased PrP staining but similar neuroanatomical distribution compared with vehicle-treated control (black). GFAP staining was more intense in the cortex of mice treated with compound 1. (B) Treatment with compounds 14 (orange), 37 (blue), and 41 (green) all changed the intensity and distribution of neuropathological lesions compared with vehicle-treated control (black). Sc, sensory cortex; Hp, hippocampus; Th, thalamus; Mc, motor cortex; St, striatum; Cb, cerebellum; Po, pons.

