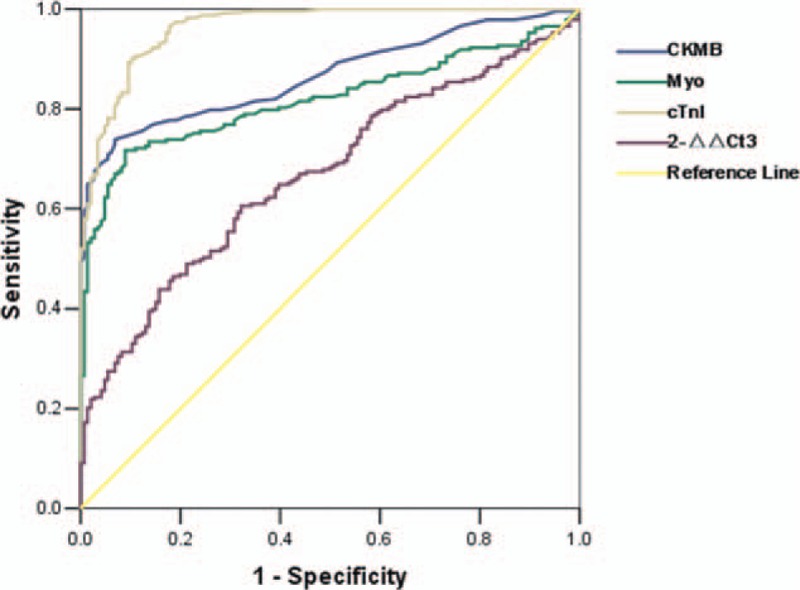
FIGURE 5.

Receiver operating characteristics (ROC) curve analysis of miR-133a, accu-cTnI, CK-MB, myoglobin in the AMI group (STEMI, NSTEMI) versus non-AMI group (UAP, NCCP, controls) on admission, P < 0.001.

Receiver operating characteristics (ROC) curve analysis of miR-133a, accu-cTnI, CK-MB, myoglobin in the AMI group (STEMI, NSTEMI) versus non-AMI group (UAP, NCCP, controls) on admission, P < 0.001.