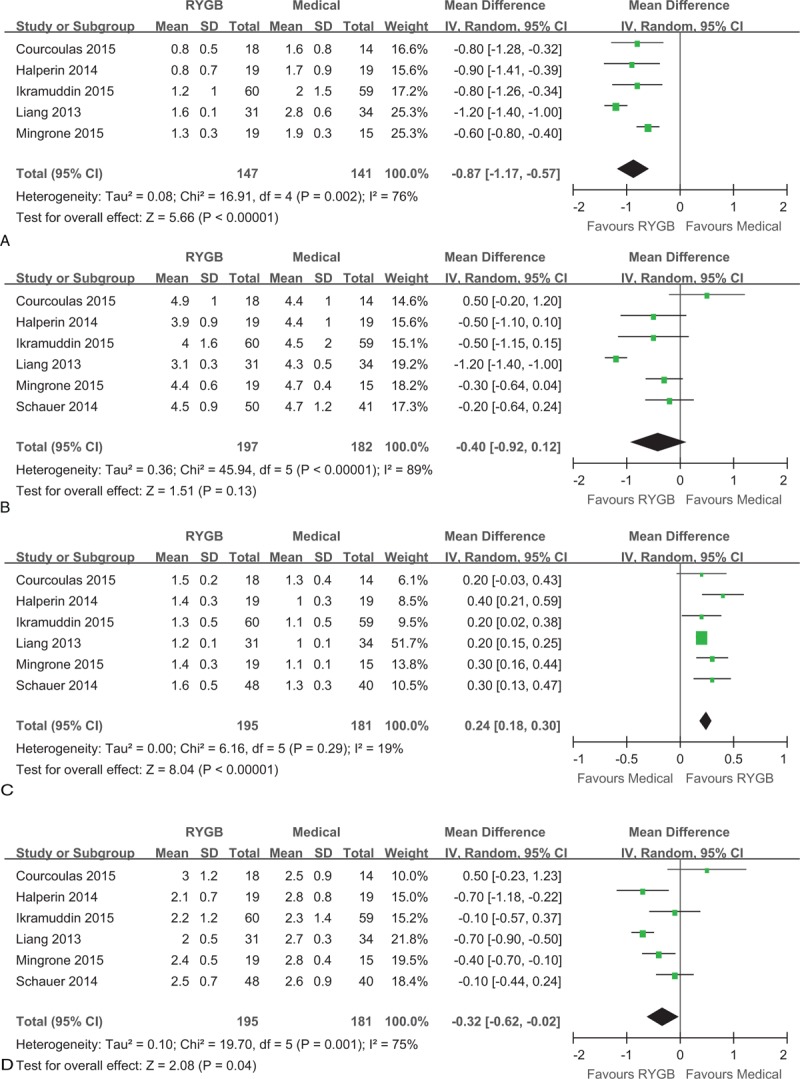
FIGURE 5.

Forest plot of triglyceride (A), total cholesterol (B), high-density lipoprotein cholesterol (C), and low-density lipoprotein cholesterol (D) after RYGB surgery compared to medical treatment. The levels of triglyceride (MD: –0.87, 95% CI: –1.17 to –0.57, P < 0.001) and low-density lipoprotein cholesterol (MD: –0.32, 95% CI: –0.62 to –0.02, P = 0.04) were lower in the RYGB group than the medical group. The total cholesterol level was similar in RYGB and medical groups (MD: –0.40, 95% CI: –0.92 to 0.12, P = 0.13). The high-density lipoprotein cholesterol (MD: 0.24, 95% CI: 0.18–0.30, P < 0.001) level was higher in the RYGB group than the medical group. CI = confidence interval, MD = mean difference, RYGB = Roux-en-Y gastric bypass.
