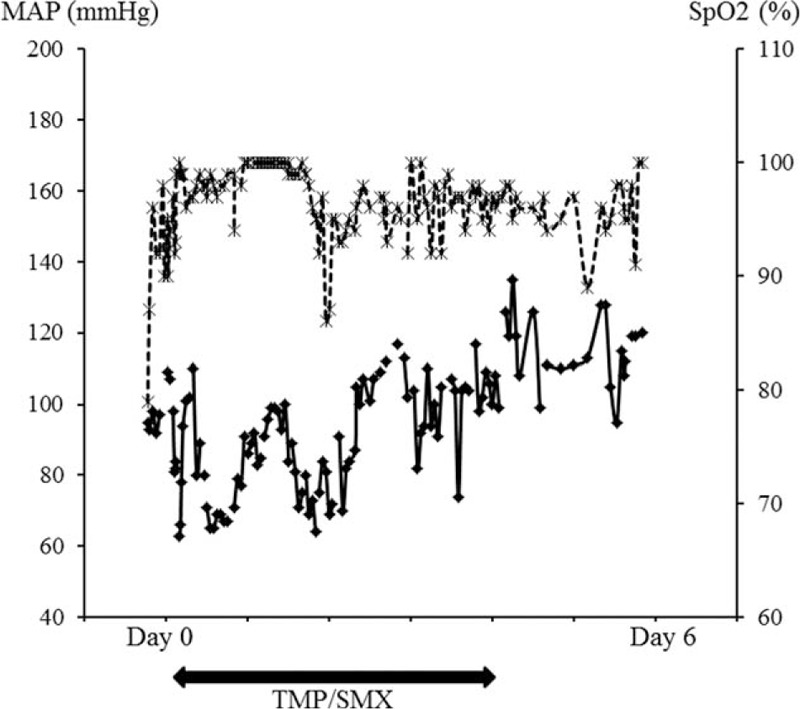
FIGURE 3.

Course of mean arterial pressure (MAP, diamond markers with straight line on the left y-axis) and SpO2 (x markers with dotted line on the right y-axis) over the first 6 days of admission. TMP/SMX was started on admission (day 0) and stopped at day 4. Scales are different for the sake of legibility. Except for initial hypoxemia (SpO2 79% on room air on admission) and a brief (1 hour) episode of desaturation at day 2 (SpO2 86–87% on O2 2 liters), MAP and SpO2 remained above 65 mmHg and 90% respectively.
