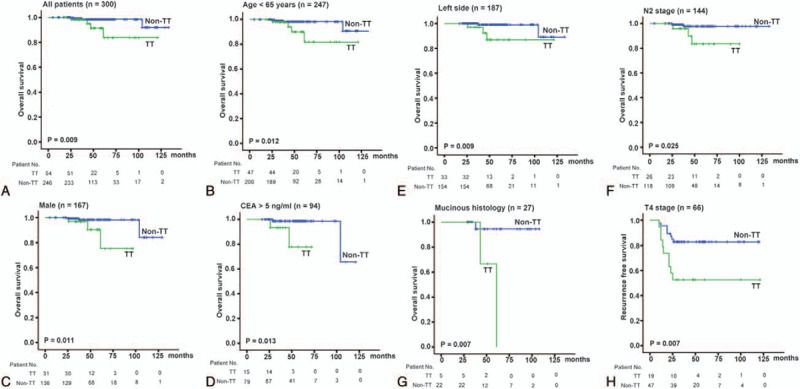
FIGURE 2.

Kaplan–Meier survival curves with log-rank test stratified by GALNT14 “TT” and “non-TT” genotypes. (A) The OS of stage III CRC patients (n = 300, P = 0.009). (B) The OS of patients with ages ≤65 years (n = 247, P = 0.012). (C) The OS of male patients (n = 167, P = 0.011). (D) The OS of patients with CEA >5 ng/mL (n = 94, P = 0.013). (E) The OS of patients with left-side CRC (n = 187, P = 0.009). (F) The OS of patients with N2 stage (n = 144, P = 0.025). (G) The OS of patients with mucinous CRC (n = 27, P = 0.007). (H) The RFS of patients with T4 stage (n = 66, P = 0.007). CEA = carcinoembryonic antigen, CRC = colorectal cancer, GALNT14 = N-acetylgalactosaminyltransferase 14, OS = overall survival, RFS = recurrence-free survival.
