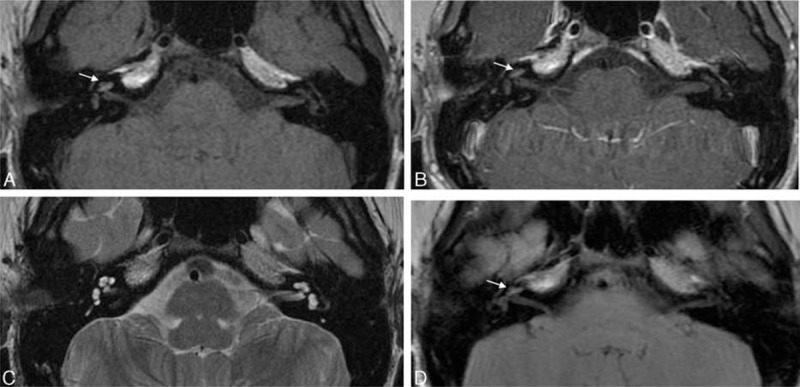
FIGURE 3.

Labyrinthine hemorrhage. An axial precontrast T1-weighted image (A) reveals slightly higher signal intensity in the right labyrinth (arrow). An axial contrast-enhanced T1-weighted image (B) demonstrates no appreciable increase in the high-intensity signal in the right labyrinth (arrow). An axial T2-weighted image (C) shows symmetric signal intensity in both labyrinths. A T2 fluid-attenuated inversion recovery image (D) shows slightly increased signal intensity in the right labyrinth (arrow).
