FIGURE 1.

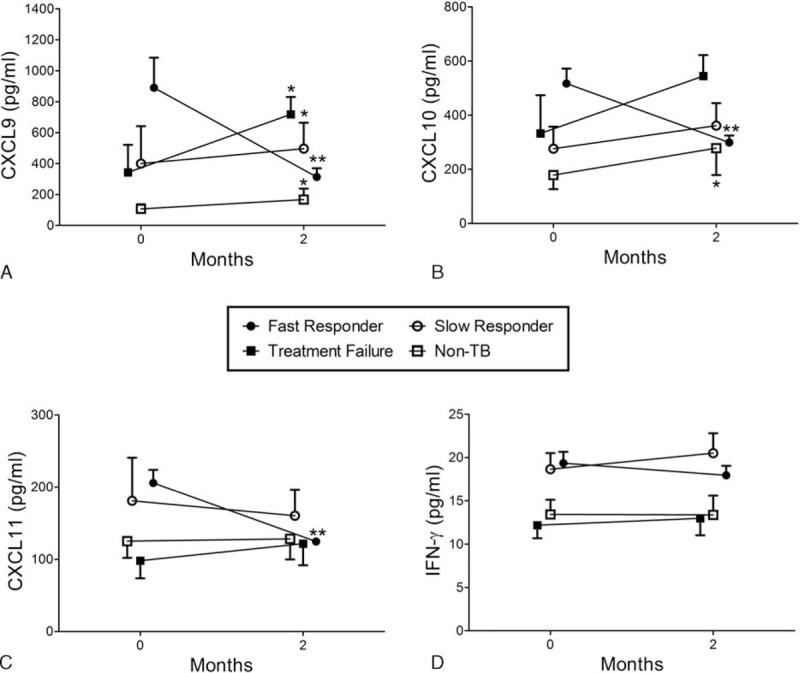
The serum levels of (A) CXCL9, (B) CXCL10, (C) CXCL11, and (D) interferon (IFN)-γ before and 2 months after the start of treatment in the following TB patient subgroups: fast responders with treatment success (●, n = 58), slow responders with treatment success (○, n = 20), TB patients with treatment failure (▪, n = 5), and non-TB patients (□, n = 5). The time points on the horizontal axis represent before treatment (baseline, 0 months) and 2 months after the initiation of treatment. The treatment response was defined as “fast” when all bacteriologic, radiologic, and clinical features of TB were improved at 2 months of treatment. If any of these features persisted after 2 months, the treatment response was considered to be “slow.” ∗P < 0.05 and ∗∗P < 0.01 compared with baseline levels.
