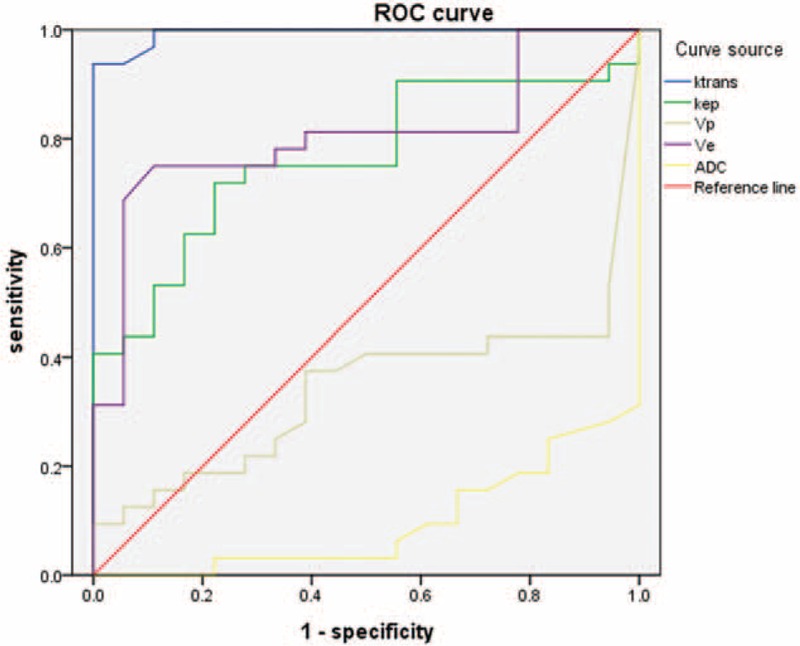
FIGURE 7.

The diagnostic efficacy of different MRI parameters for CD. The area under the curve was 0.994 for Ktrans, 0.905 for ADC, 0.806 for Ve, and 0.764 for Kep, indicating that Ktrans and ADC were superior to Ve or Kep for CD prediction. ROC analysis also revealed Vp to be little diagnostic value (0.340). ADC = apparent diffusion coefficient; CD = Crohn's disease; ROC = receiver operating characteristic.
