Figure 2.
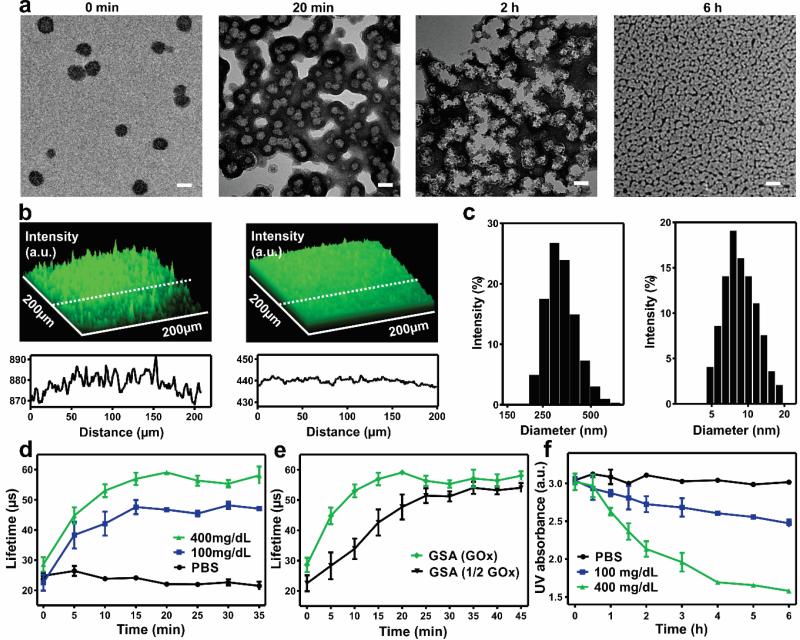
Characterization of glucose signal amplifier (GSA). a) TEM images of enzymes-encapsulated GSA pre-, post-incubated in 400 mg/dL glucose solution for 20 min, 2 h and 6 h at 37°C respectively. Scale bar is 200 nm. b) (Top) Fluorescence 2.5D images of FITC-enzymes loaded GSA solution pre- and post- incubated in 400 mg/dL glucose solution for 2 h at 37°C. (Bottom) Distribution of the fluorescence intensity along the indicated white dash line. a.u., arbitrary unit. c) Size distribution of GSA pre- and post- incubated in 400 mg/dL glucose solution for 6 h. d) Phosphorescence lifetime profile for the GSA incubated in different glucose level solutions containing an oxygen concentration molecule probe. e) Phosphorescence lifetime profile for the GSA loaded with full or half dose of GOx in 400 mg/dL glucose solutions. f) Intensity of UV absorption at 330 nm of GSA in solutions with different glucose concentrations at 37 °C. Error bars indicate standard deviation (s.d.) (n = 3).

