
FIGURE 1.
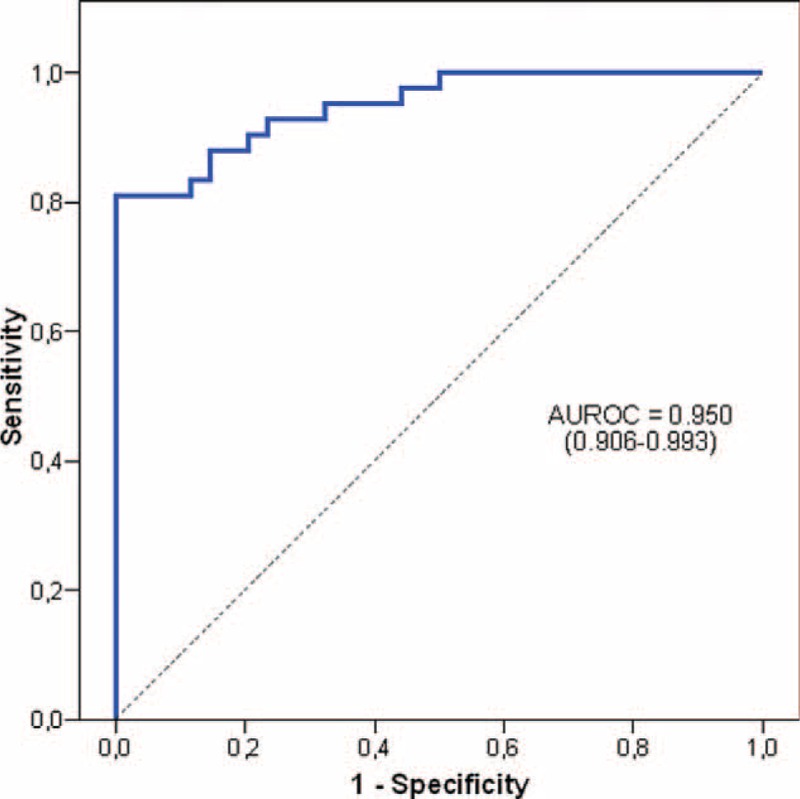
Receiver operating characteristic curve provided by the model constructed to establish the predictive value for insulin resistance (HOMA-IR > 3).
Official websites use .gov
A
.gov website belongs to an official
government organization in the United States.
Secure .gov websites use HTTPS
A lock (
) or https:// means you've safely
connected to the .gov website. Share sensitive
information only on official, secure websites.
Receiver operating characteristic curve provided by the model constructed to establish the predictive value for insulin resistance (HOMA-IR > 3).