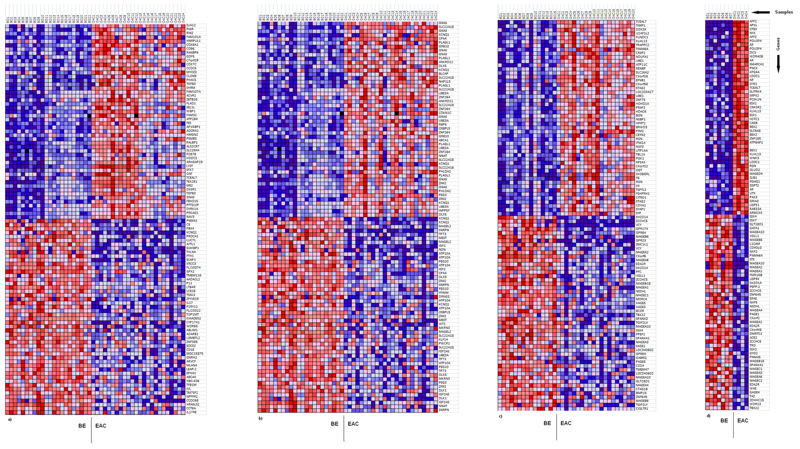
Figure 1.
GSEA generated heat maps for the top 50 probes showing greatest differential methylation between BE and EAC (red color = high methylation, blue color = low methylation). a – all probes (22BE vs. 24EAC), b – imprinted genes probes (22BE vs. 24 EAC), c – X-chromosome probes (15BE vs. 20EAC, males only), d – X-chromosome probes (7BE vs. 4EAC, females only).

