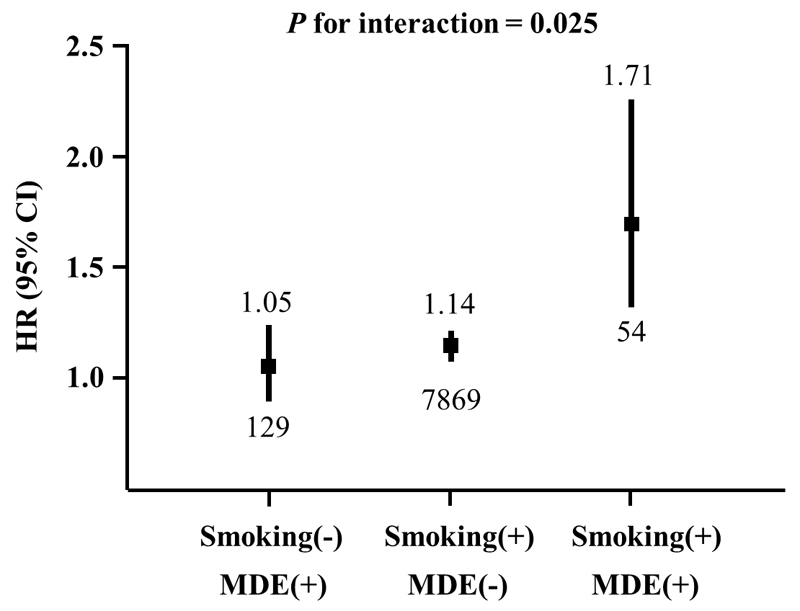
Figure 1. Interaction analysis between smoking status and baseline depression status.
Adjusted for age, sex, marital status, household income, education, region, alcohol consumption, physical activity, BMI, history of hypertension and history of diabetes. MDE, major depressive episodes. “Smoking(-) & MDE(-)” was used as the reference group. Squares represent the hazard ratios (HR) and vertical lines represent the corresponding 95% confidence intervals (95% CI). Numbers above the CIs are the HRs and numbers below the CIs represent participants with stroke events.

