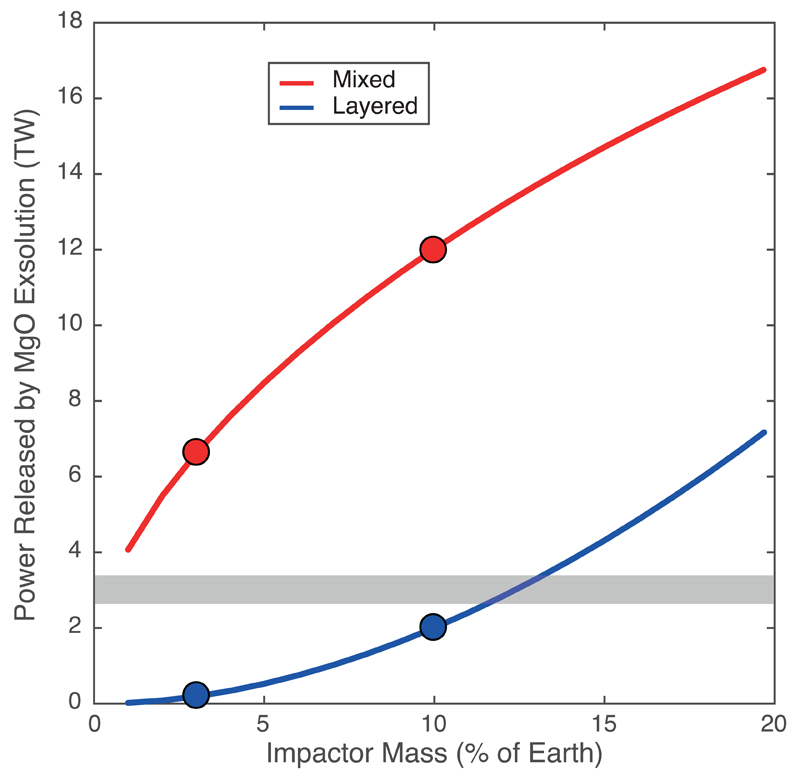
Extended Data Figure 8. Power released by exsolution if it occurs over 1 Gyr.
A companion to Fig. 3, the gravitational energy released by exsolution is converted into average power, assuming a characteristic time of exsolution of 1 Gyr. Again, the red curve corresponds to the energy released if the HIC fully mixes with Earth’s core, and the blue curve corresponds to the energy released if the HIC forms a layer on top of Earth’s core. The gray horizontal band corresponds to 3 TW, the power driving the dynamo today, and thus provides a conservative estimate as to how much power is required to run a geodynamo by compositional buoyancy22 [ref 37]. The 10% Mars-size impact19 and 2.5% “fast-spinning” impact20 are highlighted by circles. Note that the blue curve represents a lower-bound to the energy released in case of layering of the HIC, because the layer contains so much lithophile elements that it would exsolve much faster, producing more power, albeit during a shorter period. By proportionality, this plot can be used to infer the power release for any characteristic exsolution time.

