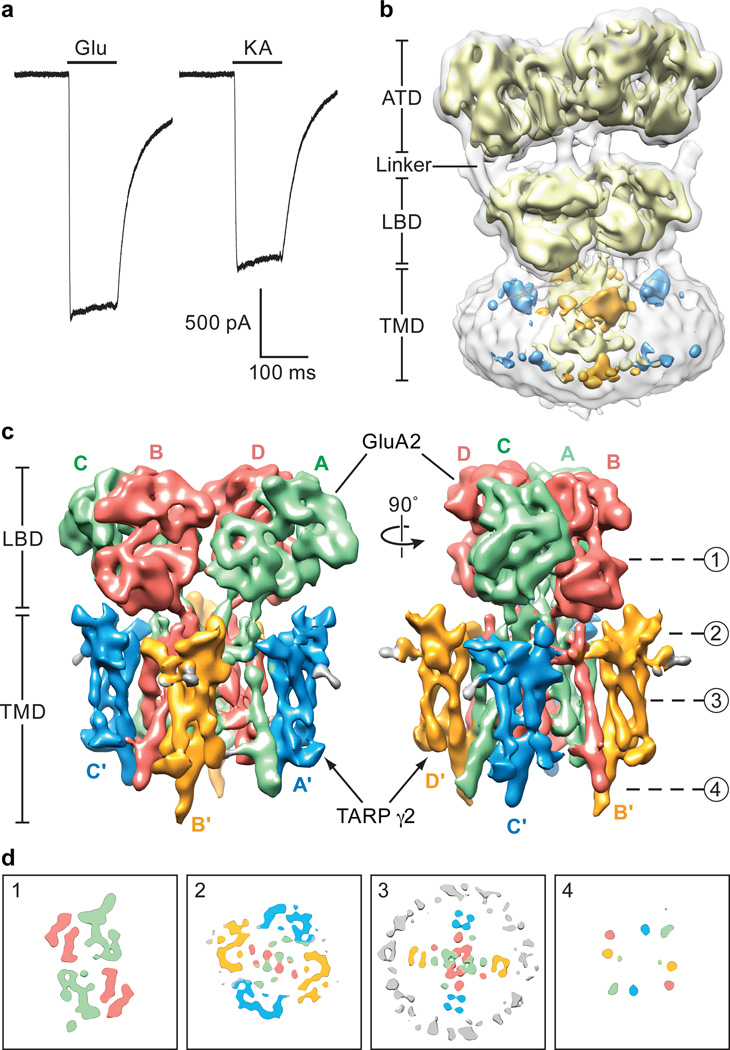
Figure 1. Function and reconstruction of GluA2-TARP γ2 complex.
a, Whole-cell patch clamp recordings from cells expressing the GluA2 – TARP γ2 complex. A representative pair of currents recorded using the same cell is shown. The ratio between steady-state currents evoked by kainate and glutamate is 0.80±0.02 (mean ± standard deviation, n=5). b, Initial 3D-reconstruction of GluA2-TARP γ2 complex contoured at lower (outer) and higher (inner) threshold levels showing distinct features for the receptor and associated TARP. c, Refined 3D-reconstruction focused on LBD and TMD layers, where the ATDs were excluded from refinement. A/C and B/D subunits of the GluA2 receptor are in green and red, respectively; TARP γ2 associated with receptor A/C and B/D subunits are in blue and gold, respectively. d, Cross-sections of the EM map at LBD layer, TARP-LBD interface layer, TMD layer and C-terminal layer at indicated ‘height’, with density features colored as in panel (c).

