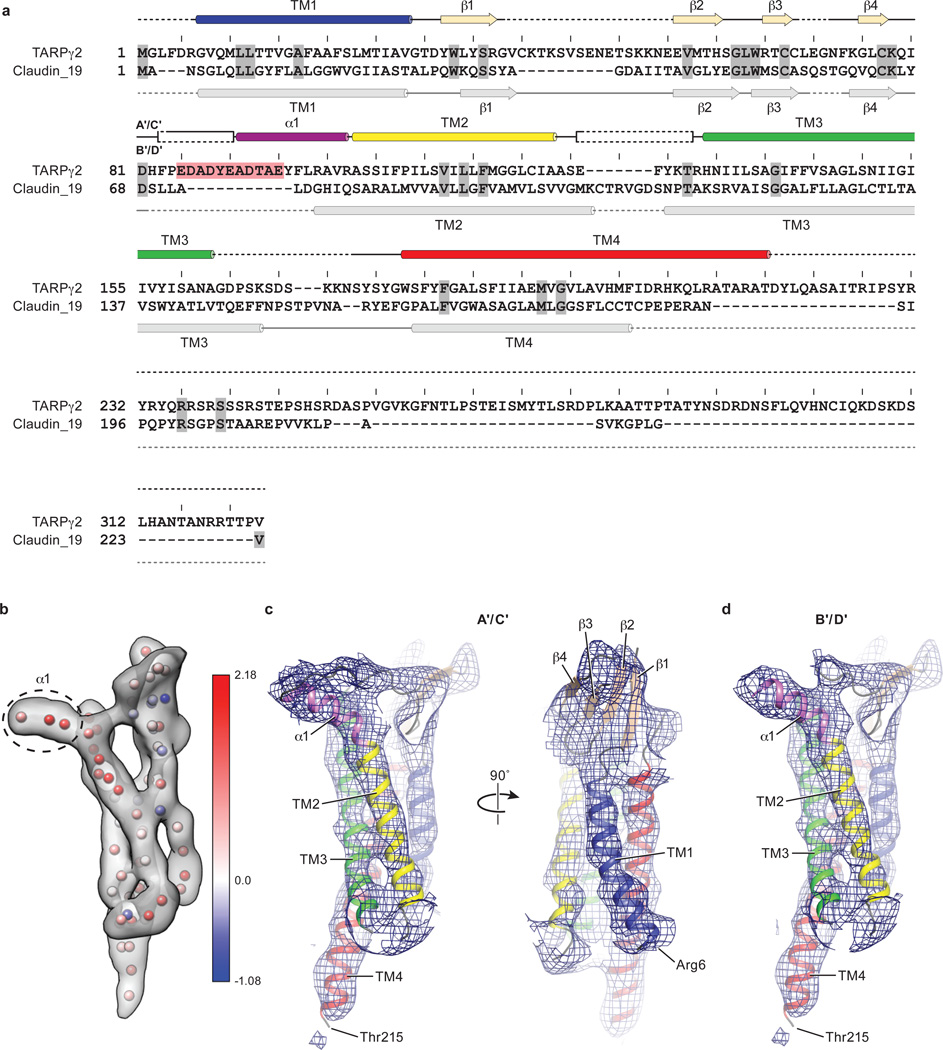
Extended Data Figure 4. Structures of the TARP γ2 subunits in the context of the respective cryo-EM density map.
a, Sequence alignment between TARP γ2 and claudin-19 calculated using Clustal omega. Also shown above the alignments are the secondary structure elements of TARP γ2 based on the model reported here, and below the aligned sequences are the secondary structure elements derived from the claudin-19 crystal structure. The ECD region rich in negative charges is conserved throughout the TARP family and highlighted in red. b, EM density for B’ TARP and pseudo-atoms placed by SSEhunter, each colored according to a calculated secondary structure score. Positive and negative scores indicate α-helix and β-sheet propensity, respectively. Dashed-line circles a map region where high scores were found, suggesting the presence of helical structure. A scale bar ranging from a maximum positive value (α-helix) to the minimum negative score (β-strand) is shown. c, The A’ TARP of the A’/C’ pair. d, The B’ TARP of the B’/D’ pair. The first and last visible residues Arg6 and Thr215 were labeled. Secondary structure elements were color-coded as in panel a.

