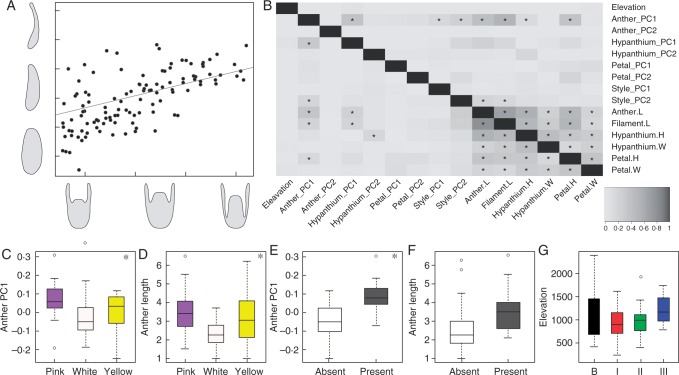
Fig. 7.
(A) pgls model of the first component of hypanthium shape and the first component of anther shape. (B) Correlogram of flower structures and elevation (pgls). Asterisks indicate significant correlations; grey shades reflect the R2 values, indicated in the box at the bottom right of the panel. H, height; W, width; L, length. (C–G) Box plots of variables and groups. Asterisks indicate significance in the phylogenetic ANOVA test. (C) First component of anther shape by anther colour. (D) Anther length by anther colour. (E) First component of anther shape by presence/absence of glomerules. (F) Anther length by presence/absence of glomerules. (G) Elevation by flower regimes. Left to right: background (B), regimes I, II and III.

