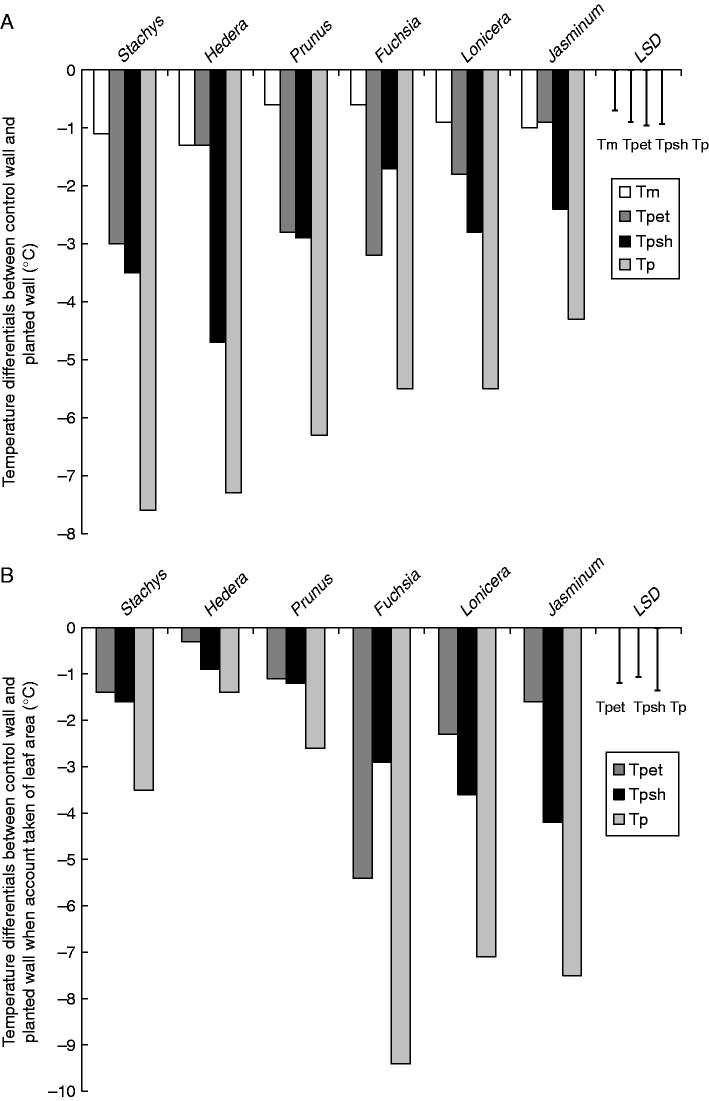
Fig. 3.
(A) Comparison of mean cooling (temperature differential, °C) for walls screened with different species and bare control walls (Tp), and derived values for cooling due to shade (Tpsh), evapotranspiration (Tpet) and evaporation from medium (Tm). Bars = Least significant difference (LSD) (P=0·05); d.f. = 32. Modified from Cameron et al. (2014). (B) Comparison of mean cooling (temperature differential, °C) for walls screened with different species and bare control walls, based on leaf area index (Tp), and derived values for cooling due to shade (Tpsh), evapotranspiration (Tpet) and evaporation from medium (Tm). Bars = LSD (P=0·05); d.f. = 32. Modified from Cameron et al. (2014).

