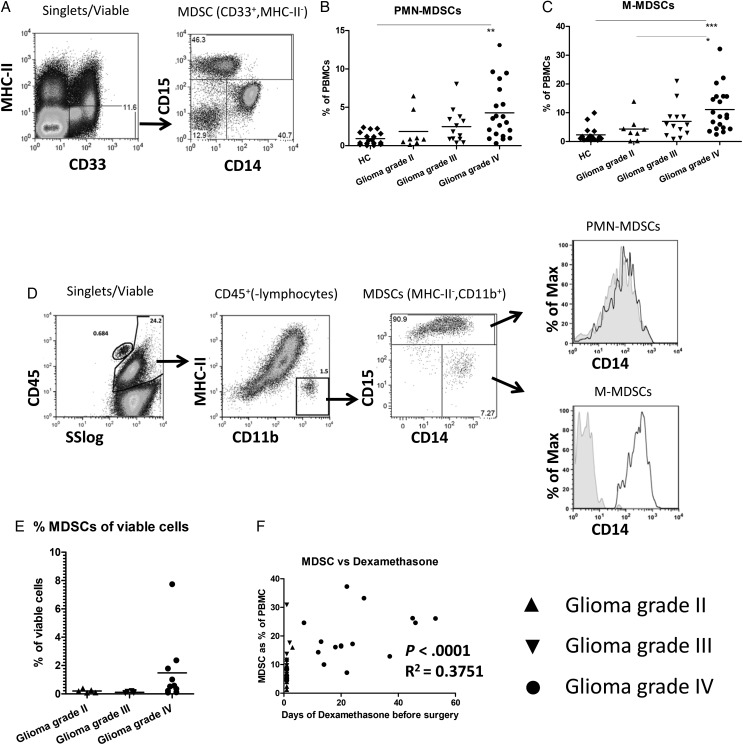
Fig. 1.
Increased myeloid-derived suppressor cell (MDSC) numbers in blood and tumor tissue of patients with high grade glioma. (A) Gating strategy for MDSCs. Peripheral blood mononuclear cells (PBMCs) were stained as described, and single, viable cells were plotted for CD33 and MHC-II expression (left panel). CD33+MHC-II− cells were further plotted for CD14 and CD15 (right panel). (B and C) The percentages of PMN-MDSC (B) and M-MDSC (C) are shown as a percentage of total PBMCs. Data points were displayed in grouped column scatters separating the healthy controls (HCs; (n = 17)) and patients with a grade II (n = 8), grade III (n = 13) or grade IV (n = 20) glioma. Asterisks represent statistical significance (*P < .05; ** P < .01; *** P < .001). (D) Tumor tissue single cell suspensions were stained as described, and single, viable cells were plotted for CD45 expression against the sideward scatter (SS)(left panel). CD45+ cells excluding lymphocytes were plotted for CD11b and MHC-II (second panel). CD11b+MHC-II− cells were plotted for CD14 and CD15 (third panel). PMN-MDSCs or M-MDSCs were plotted for CD14 expression with the isotype staining displayed in gray (CD15− MDSCs displaying the isotype of M-MDSCs). (E) Percentage of CD45+CD11b+MHC-II− cells plotted as a percentage of the total number of viable cells. (F) The percentage of MDSCs in blood plotted against the number of days of dexamethasone treatment before surgery. Relevant statistics of all glioma samples combined are incorporated within Fig. 1F.

