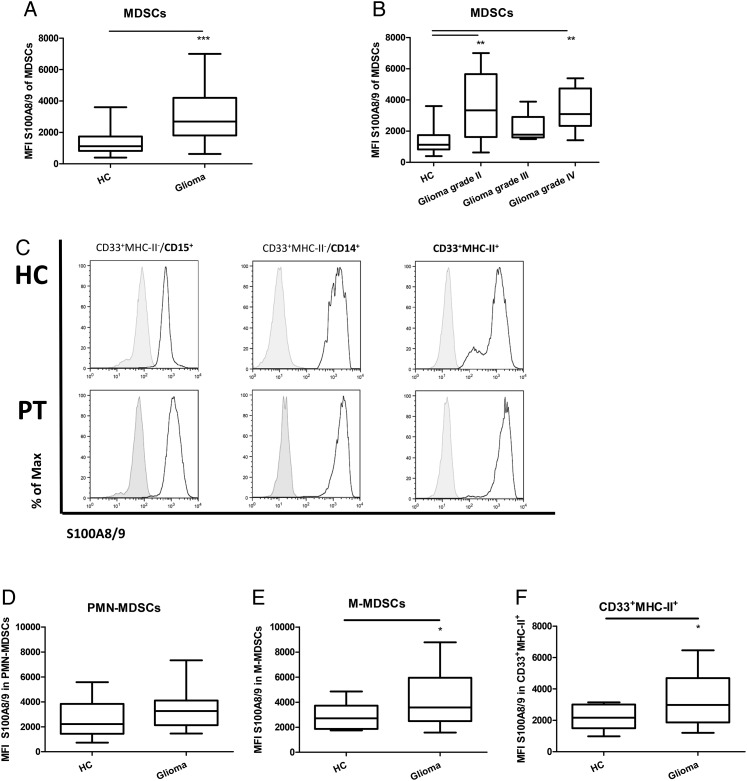
Fig. 2.
Increase of S100A8/9 expression in myeloid cells. (A and B) CD33+MHC-II− cells were gated as in Fig. 1A. S100A8/9 mean fluorescent intensity (mfi) data are displayed in whisker plots. Data of glioma patients were either combined (A) or divided based on malignancy (B) and compared with healthy controls (HCs). Asterisks represent statistical significance (*P < .05; ** P < .01; *** P < .001). (C) myeloid-derived suppressor cells (MDSCs) from either HC (top panels) or glioma patients (PT; lower panels) were gated on PMN-MDSC (left panel) or M-MDSC (middle panel) subpopulations and plotted for S100A8/9. Additionally, CD33+MHC-II+ cells were plotted for S100A8/9 expression (right panels). Representative histograms of 17 HC and 20 patients with glioma (5 grade II; 4 grade III; 10 grade IV) are shown with the black line displaying the S100A8/9 staining and the gray histogram displaying the isotype. (D–F) Whisker plots of mfi of S100A8/9 in PMN-MDSCs (D), M-MDSCs (E) and CD33+MHC-II+ (F) cells.

