Fig. 5.
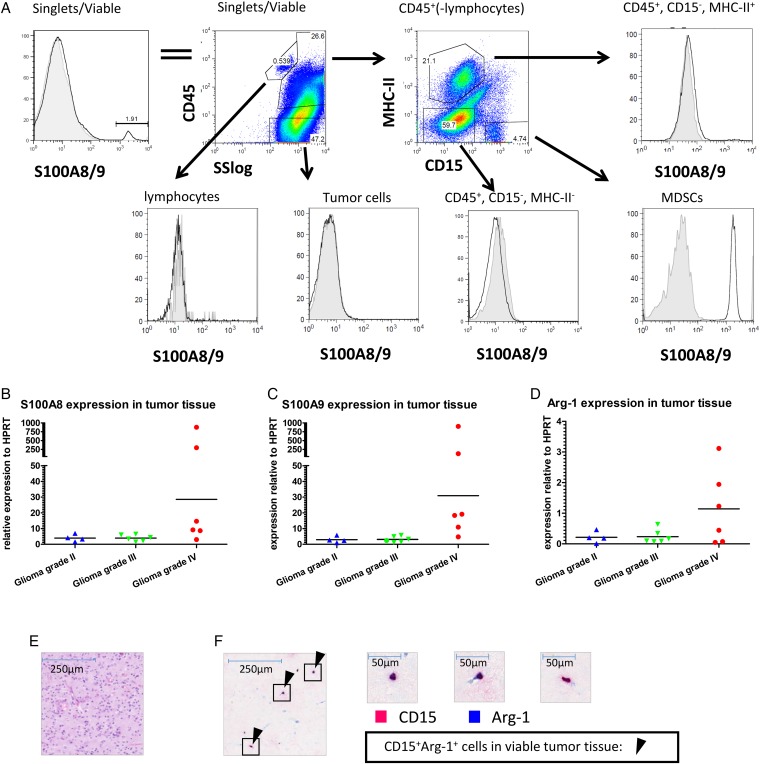
S100A8/9 and arginase expression in tumor tissue. (A) Tumor tissue single cell suspensions were stained as described and analyzed using flow cytometry. Single, viable cells were plotted for S100A8/9 (top left panel) and subsequently plotted for CD45 expression against the sideward scatter (SS; top second panel). CD45+ cells excluding lymphocytes were plotted for CD15 and MHC-II (top third panel). Lymphocytes (CD45+SSlow) (bottom left panel), tumor cells (CD45−) (bottom second panel), CD45+MHC-II+ (top right panel), CD45+MHC-II−CD15− (bottom third panel) and PMN-MDSCs (CD45+CD15+MHC-II−) (bottom right panel) were plotted for S100A8/9 expression. A representative plot from 6 donors measured is displayed. (B–D) S100A8 (B), S100A9 (C) and arginase (D) expression of tumor tissue single cell suspension was measured by qPCR with Ct values plotted relative to HPRT in a scattered plot. Grade II (n = 4; blue triangles), grade III (n = 6; green triangles) or grade IV gliomas (n = 7; red dots) were grouped. (E&F) H&E staining (E) or IHC double staining (F) with CD15 (pink) and arginase (blue) (original magnification x50) of glioma histological sections. Arrows highlight some CD15+arginase+ cells. Three frames from the IHC double staining are further enlarged (x400).

