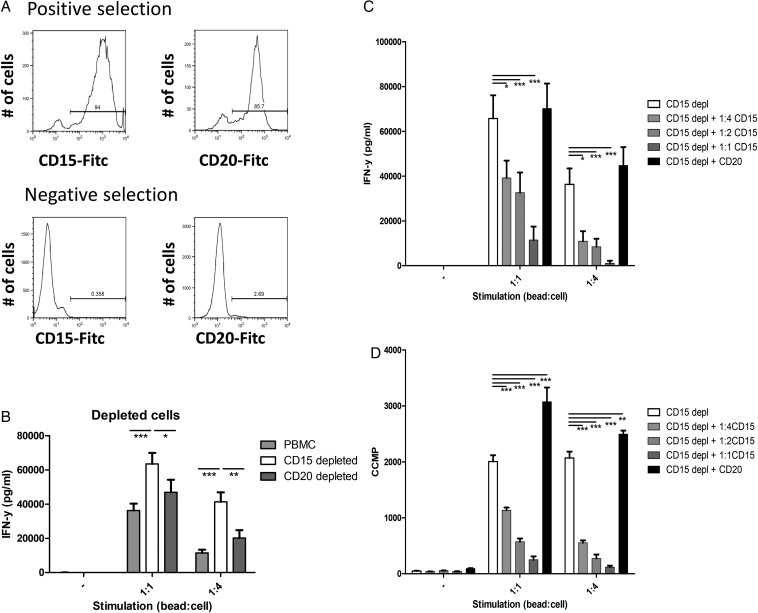
Fig. 6.
Polymorphonuclear (PMN)- myeloid-derived suppressor cells (MDSCs) from glioma patients suppress T cell function. (A) Representative histograms of positively (top panels) and negatively (bottom panels) MACS-sorted populations, sorted for CD15 (left panels) or CD20 (right panels). (B) Secreted IFN-y of peripheral blood mononuclear cells (PBMCs) not stimulated or stimulated with anti-CD3/anti-28 beads in a 1:1 or 1:4 ratio (1 bead: 4 cells). Data of total PBMCs (light gray), CD15 depleted PBMCs (white) or CD20 depleted PBMCs (dark grey) with error bars representing standard error of the mean (SEM). (C and D) Secreted IFN-y and tritium incorporation (D) of CD15 depleted PBMCs. Data are shown for CD15 depleted PBMCs (white), CD15 depleted PBMCs + CD15+ cells (1:4(light gray), 1:2 (gray) or 1:1 (dark gray)), CD15 depleted PBMC's + CD20+ cells (1:1 (black)). Cell ratio 1:2 (or 1:4) represents ratio of CD15 depleted PBMCs:CD15+ cells. Data of 3 independent experiments with each 3 replicates are combined. Asterisks represent statistical significance (*P < .05; **P < .01; ***P < .001) compared with CD15 depleted PBMC samples.

