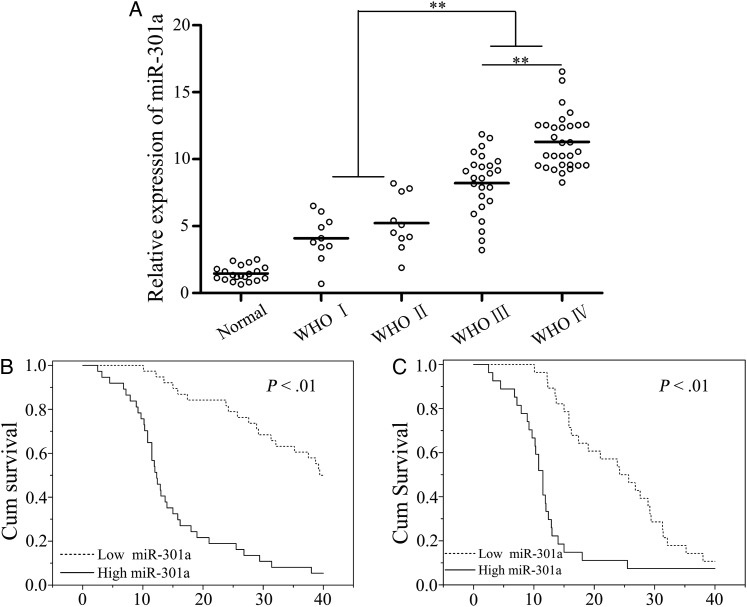
Fig. 1.
Analysis of miR-301a expression and the effect on glioma patient survival. (A) miR-301a expression in glioma and normal brain tissues as detected by quantitative PCR. (B) Kaplan-Meier (KM) survival curves analyzed glioma patients who had high or low expression of miR-301a. (C) KM survival curves analyzed high-grade glioma patients (III–IV) with high or low expression of miR-301a. *P < .01 as compared with normal brain tissues.

