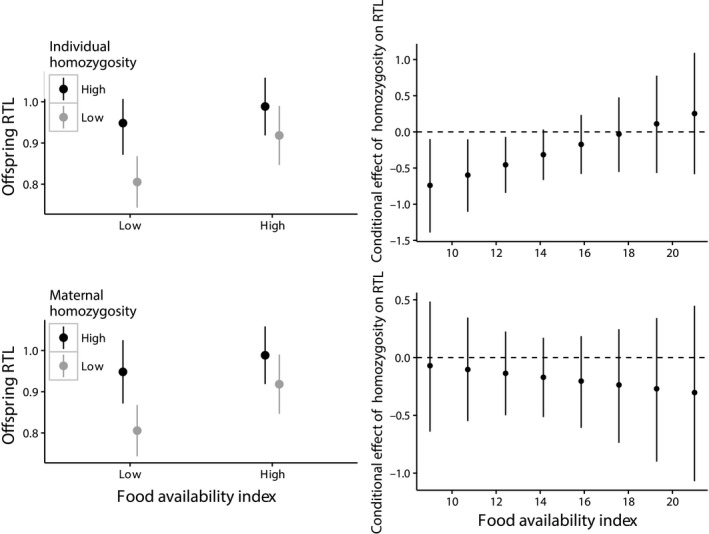
Figure 1.

Relationship between standardized individual homozygosity (top row) or standardized maternal homozygosity (bottom row) and relative telomere length of juveniles born in years of high and low food availability, using raw data. In the left‐hand plots, food availability was split into a factor according to the median value for visual clarity, but was modelled as a continuous variable. Right‐hand plots display the conditional effect of homozygosity on RTL, across the range of food availability values. The value on the y‐axis indicates the direction of the homozygosity effect on RTL, given the value on the x‐axis. Bars represent 95% confidence limits.
