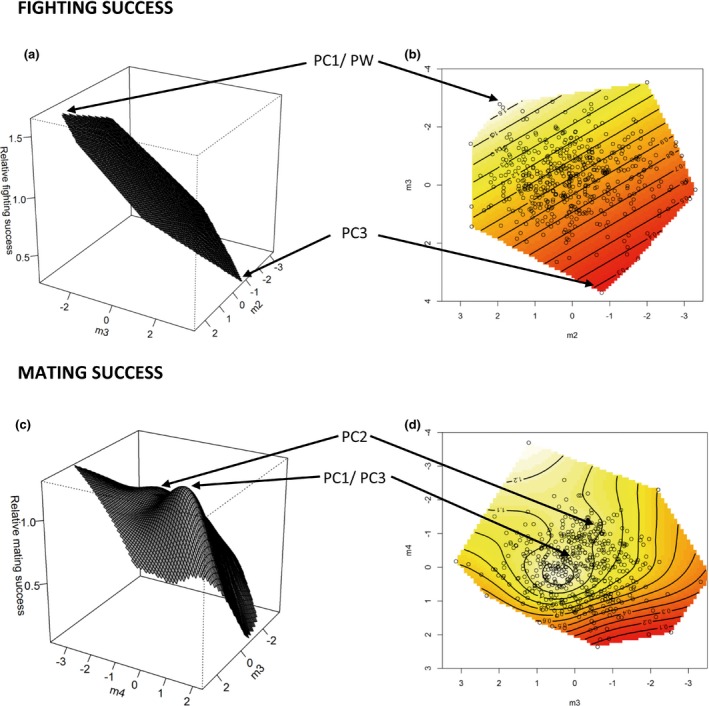
Figure 1.

Thin‐plate spline visualization of the major canonical axes for fighting success (a and b) and mating success (c and d). The three‐dimensional surfaces on the left (a and c) show a perspective view while the contour plots on the right (b and d) show the same surfaces from above. The highest peaks are labelled with the traits that contribute most strongly to these regions of high/low fitness when the coefficients of both eigenvectors are interpreted together. Points on the contour plots represent actual males and white/very pale yellow areas indicate areas of highest/high fitness whereas red areas indicate areas of lower fitness.
