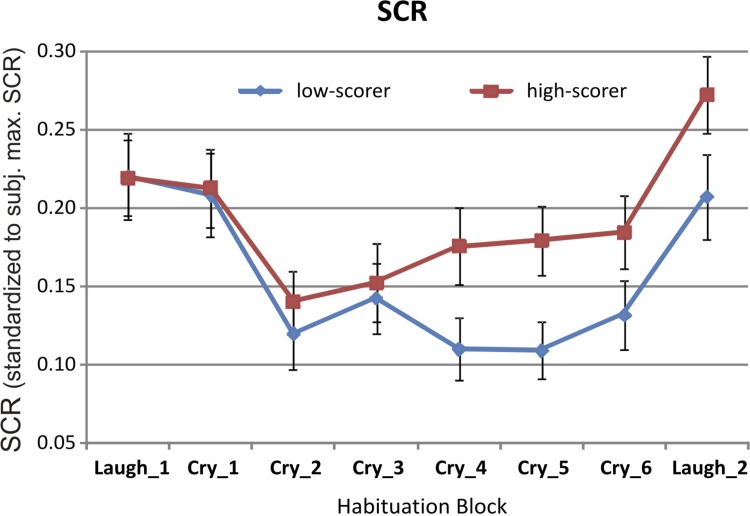
Fig 3. Illustrates time course of skin conductance responses (SCR, group means).
For this illustration the median (neuroticism score: 1.67) served as the boundary between the high and the low neuroticism groups (please note: in the statistical model neuroticism was used as continuous variable). Five video clip presentations were averaged into one block, i.e. the first block summarizes five video clip presentations that showed laughing infants at the beginning of the fMRI experiment, the following six blocks summarize each five video clip presentations that showed crying children, and finally the last block summarizes five video clip presentations that showed laughing children at the end of the fMRI experiment. Women scoring higher on neuroticism showed overall stronger skin conductance responses to the ongoing exposure to film clips of crying infants. Error bars indicate standard errors.

