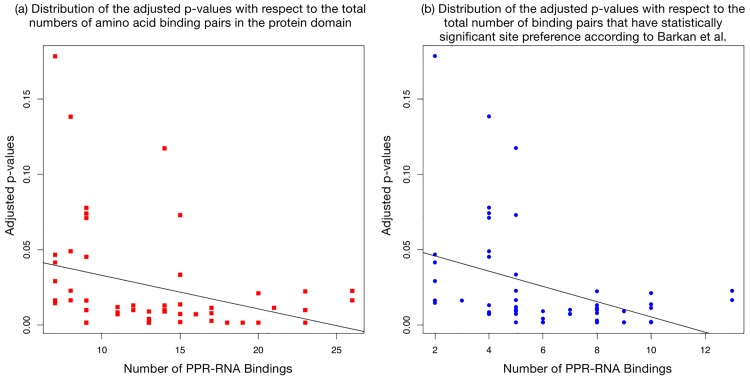
Fig 5. Illustrations that demonstrate the adjusted p-values with respect to the total number of amino acid binding pairs in the protein domain, and the adjusted p-values with respect to the total number of binding pairs that have statistically significant site preference according to Barkan et al. [6].
The regression lines on both plots demonstrate that there is an negative correlation between the number of binding pairs in the protein domain and p-value. (a) has a Pearson’s Correlation sample estimate of −0.335024 with a p-value of 0.01241. (b) has a Pearson’s Correlation sample estimate of −0.3978517 with a p-value of 0.00263.

