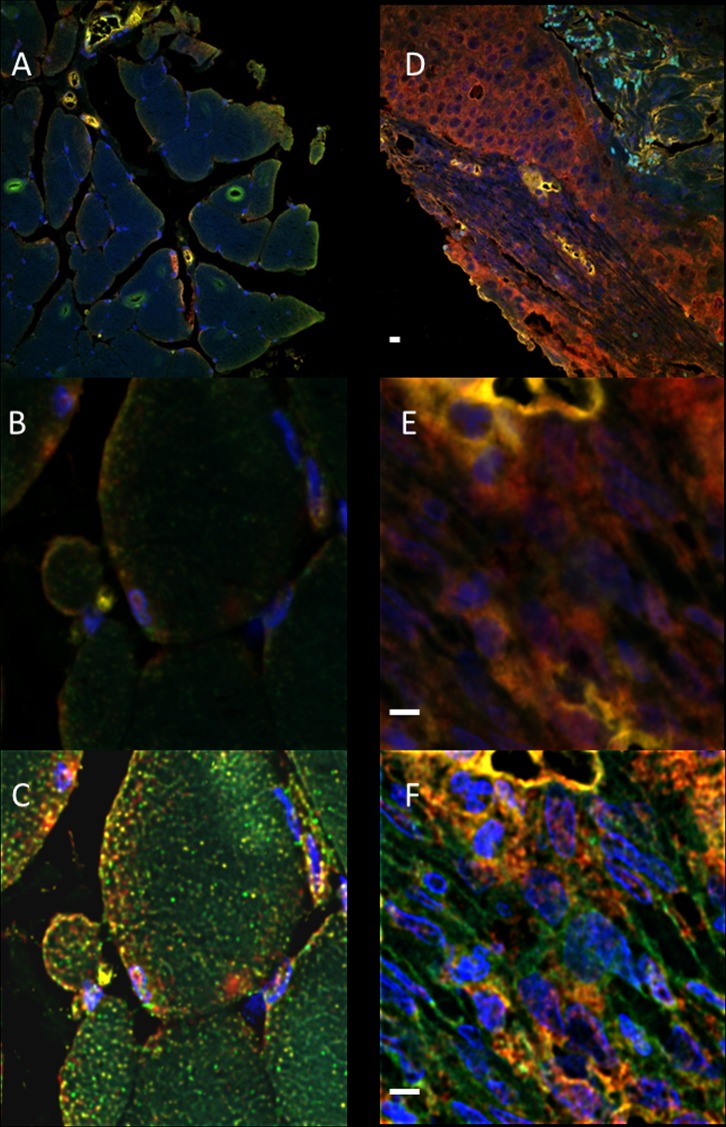
Fig 4. Multi-labeled immunofluorescence for CD1, c-Myc and FRA1.
Co-expression of three proteins CD1 (FITC-green), c-Myc (Cy3-red) and FRA1 (Cy5-cyan) in normal (A, B and C) and malignant feline oral tissue cores (D, E and F) and DAPI, counterstain is blue; images are representative tissue cores from the tissue array with over 200 samples. Whole tissue cores (S4 Fig) were imaged using a Zeiss Axioscan Z.1 slide scanner (Carl Zeiss) at 20x magnification with a Calibri.2 LED lights and integration times of the Hamamatsu ORCA Flash4 camera (Hamamatsu Photonics) and fluorescent signals were optimized at the start of study so as to not oversaturate the signal for each antibody. For quantitative co-localization a randomly selected area was imaged using an Olympus IX81 confocal system and a dry 40x objective (A, normal and D, malignant); these areas were further magnified (6x digital zoom) and re-imaged (B, normal and E, malignant). The resulting images were deconvolved using Huygens Software (C, normal and F, malignant) for the calculation of GIC (see Methods). Scale bar = 10μm.

