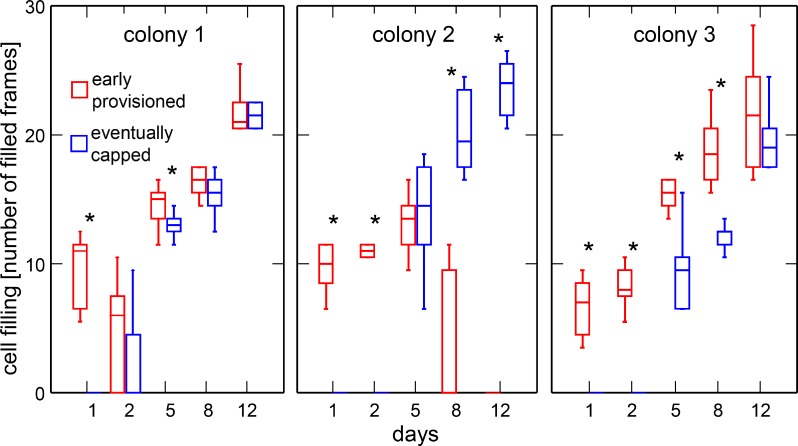
Fig 5. Comparison of the filling levels of cells provisioned early and eventually capped.
Medians, first and third quartiles as well as range are shown. Sample size is 10 cells per box. For clarity, outliers identified by Systat are not shown. Significant differences between cell types are indicated with * (Wilcoxon-Mann-Whitney test, P < 0.025).

