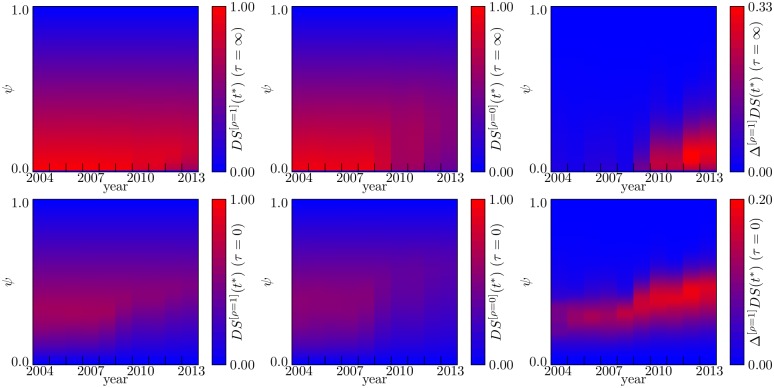
Fig 2. Heat maps of group DS(t*) as a function of ψ and of the year.
Upper plots refer to the case of no damping (τ = ∞) and lower plots to the case of instantaneous damping (τ = 0). Then, from left to right, plots show DS(t*) with liquidity shocks and ρ = 1, no liquidity shocks ρ = 0, and the difference between these values.

