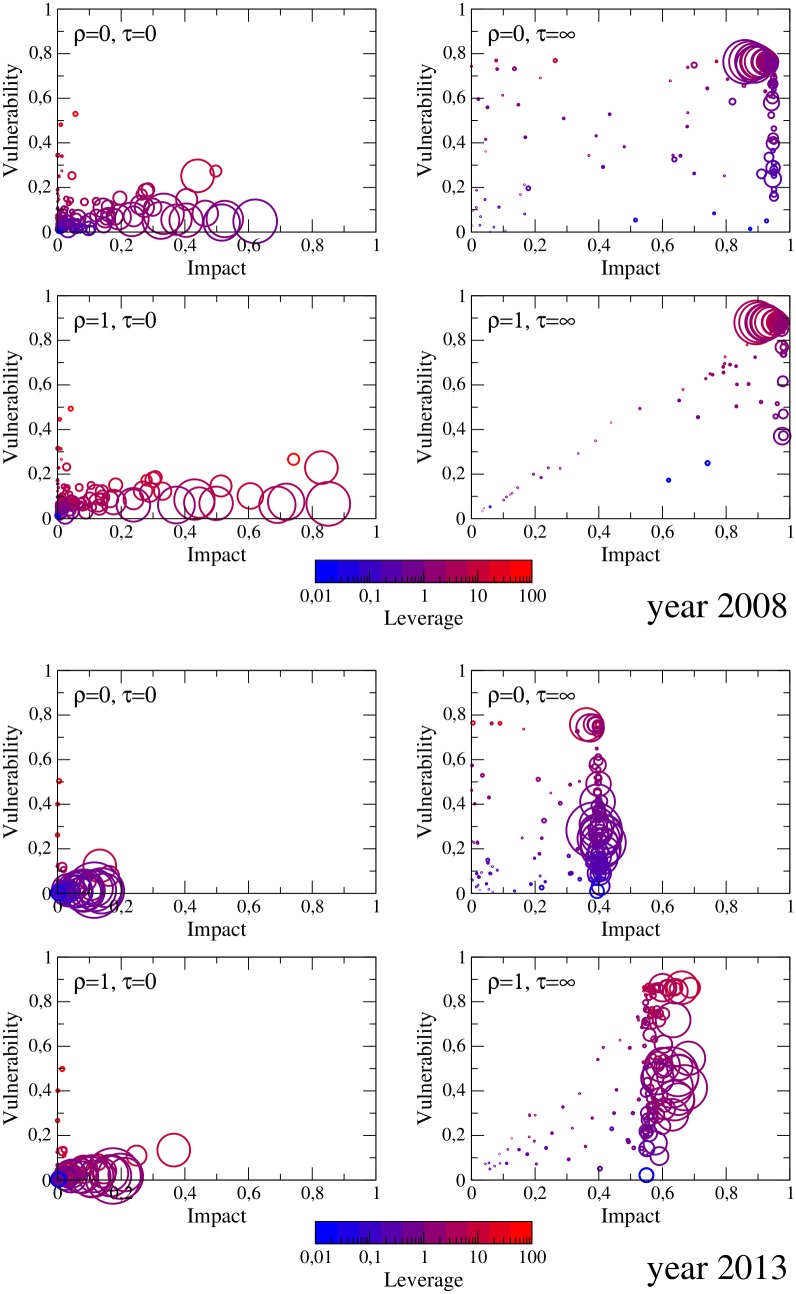
Fig 3. Scatter plot of impact and vulnerability values for each bank in years 2008 (upper panels) and 2013 (lower panels).
Here we show the cases of maximal or vanishing strength of liquidity shocks (ρ = 1 or ρ = 0, respectively) and of instantaneous or vanishing damping of shocks (τ = 0 and τ = ∞, respectively). The size of the bubble is non-linearly proportional to the initial equity of the corresponding bank: . The color of the contour is instead given by the value of the generalized leverage λΛi + ρϒi.

