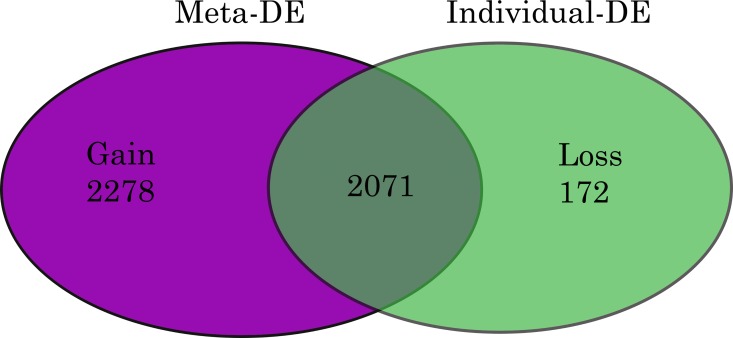
Fig 2. Venn Diagram of Differentially Expressed Genes in Pre-eclampsia.
Fig shows differentially expressed (DE) genes in PE. Meta-analysis of ‘p’ values was performed using Fishers method. MetaDE = differentially expressed genes following metaP-analysis. Gain = DE gene only found in meta-analysis result but not in any individual analysis. Loss = DE genes identified in any individual analysis, but not in the meta-analysis. Gain and Loss genes were calculated by comparing DE genes identified by meta-analysis to those from analysing individual datasets.

