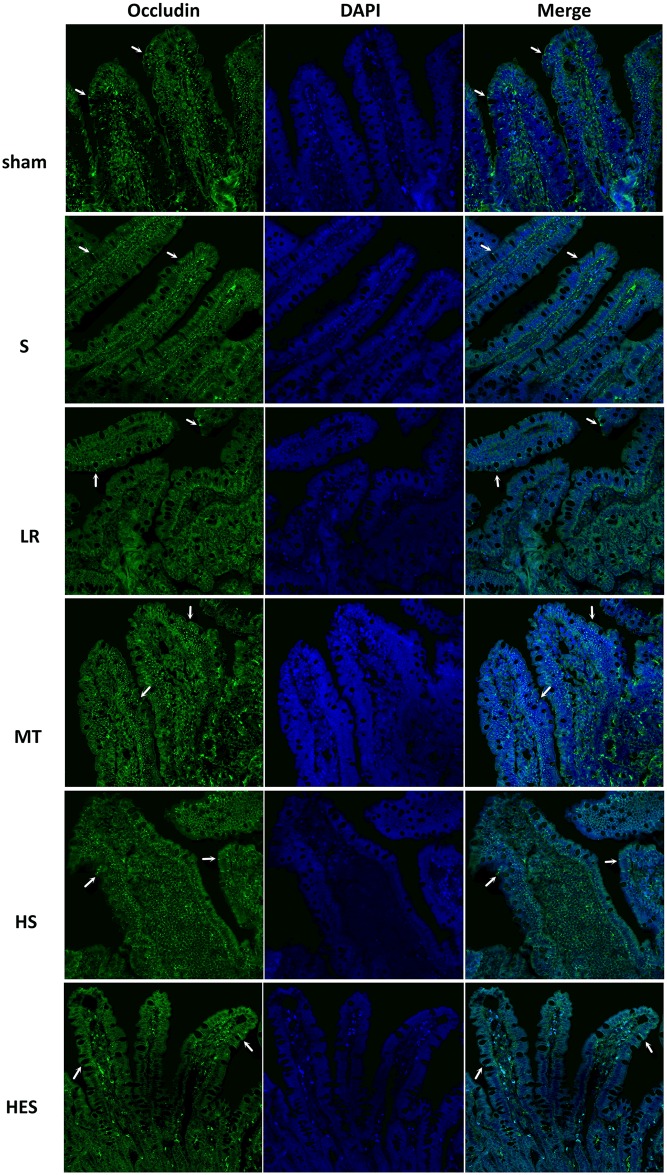
Fig 6. Representative micrographs of distribution of occludin between groups.
The tight junctions protein Occludin (green) and nuclei (blue) images were obtained by immunofluorescence analysis of tissue sections of rats jejunums (200X). Arrows indicate areas of staining. Sections from at least 4 mice were examined for each condition.

