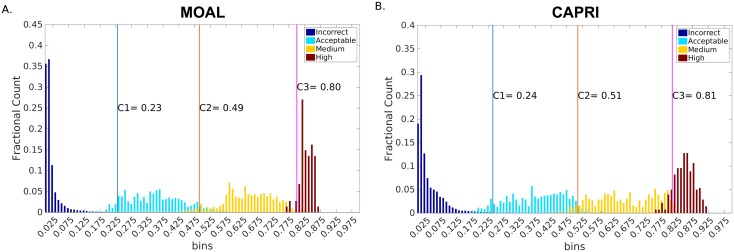
Fig 1. Distribution of DockQ score for Incorrect, Acceptable, Medium, and High quality models, respectively for (A) MOAL-set, and (B) CAPRI-set.
The colored bars corresponding to each CAPRI class represents frequency distribution of models predicted to be falling in a particular class normalized by the total number of models in that class.

