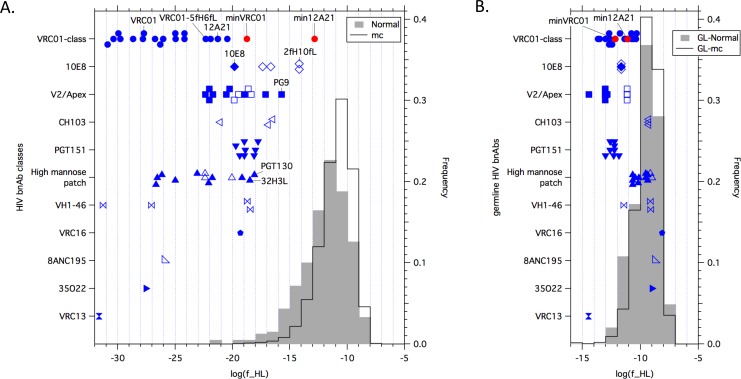
Fig 1. Antibody features frequency analysis.
(A) Log10 antibody features frequencies plotted for HIV bnAbs of different classes (left y-axis), the distribution of Log10 antibody features frequencies plotted for a set of 388 "normal" human memory (and plasmablast) antibodies isolated by B cell sorting from human memory B cells [56](and this study), influenza infection [55], HPV vaccination [54](and this study), anthrax vaccination (this study), tetanus toxoid vaccination [52], and HIV RV144 glycoprotein vaccination [51, 53] (gray histogram, right y-axis), and the distribution of Log10 antibody features frequencies plotted for a set of 300,000 antibody sequences generated by Monte Carlo ("mc") via the AFF method (black line histogram, right y-axis). Potent HIV bnAbs (mean or median IC50 < 0.5 μg/mL [27]) are shown with solid blue symbols, while less potent HIV bnAbs (mean or median 0.5 ≤ IC50 < 5.0 μg/mL) are shown with open blue symbols. HIV bnAbs previously engineered with reduced mutations are indicated (VRC01-5fH6fL [50], the 10E8 variant 2fH10fL [50], and the PGT124 variant 32H3L [40]). The shape of the distributions for "normal" and "mc" memory antibodies reflects the smearing of the germline distributions shown in (B) to lower features frequencies due to the effects of mutations, insertions and deletions. The slightly increased smearing of the "normal" compared to the "mc" memory distribution stems from the slightly higher mutation frequencies in the "normal" Abs, which are likely due to the fact that all the "normal" Abs except those from Tiller et al. [56] were affinity-selected either by antigen-specific B cell sorting [51–54] or by direct affinity measurements on recombinant antibodies after cloning from plasmablast B cells [55]); hence, the "mc" features frequency distribution is probably a better representation of the human memory repertoire. (B) Antibody features frequencies for germline versions of the antibodies in (A). The shape of the germline distribution curve (for GL-Normal or GL-mc) reflects both the great diversity of the human antibody repertoire and combinatorial statistics. The minimum in the distribution at high features frequency (log(f) = -7) is due to germline antibodies composed of the most common VHDHJH, VHVL, and VLJL combinations and having the most common CDR-H3 and CDR-L3 lengths; such Abs have the highest features frequencies (of ~10−7), but there are relatively few such combinations, so they are created infrequently. The peak of the germline distribution at features frequency of ~10−10 is due to antibodies that utilize somewhat less frequent but not rare individual components; as there are a very large number of such combinations, these are created frequently. The tail in the distribution at low features frequency is due to germline antibodies composed of the least common VHDHJH, VHVL, and VLJL combinations and the use of rare H-CDR3 and/or L-CDR3 loop lengths. Potent HIV bnAbs with the lowest germline features frequencies either had long H-CDR3 loops (V2/Apex and PGT151) or short L-CDR3 loops combined with less frequent VL or JH chains (VRC13 and some members of the VRC01-class), and all but two HIV bnAbs (CAP256-VRC26.08, with a rare H-CDR3 length of 39, and VRC13) had germline features frequencies greater than 10−14.

